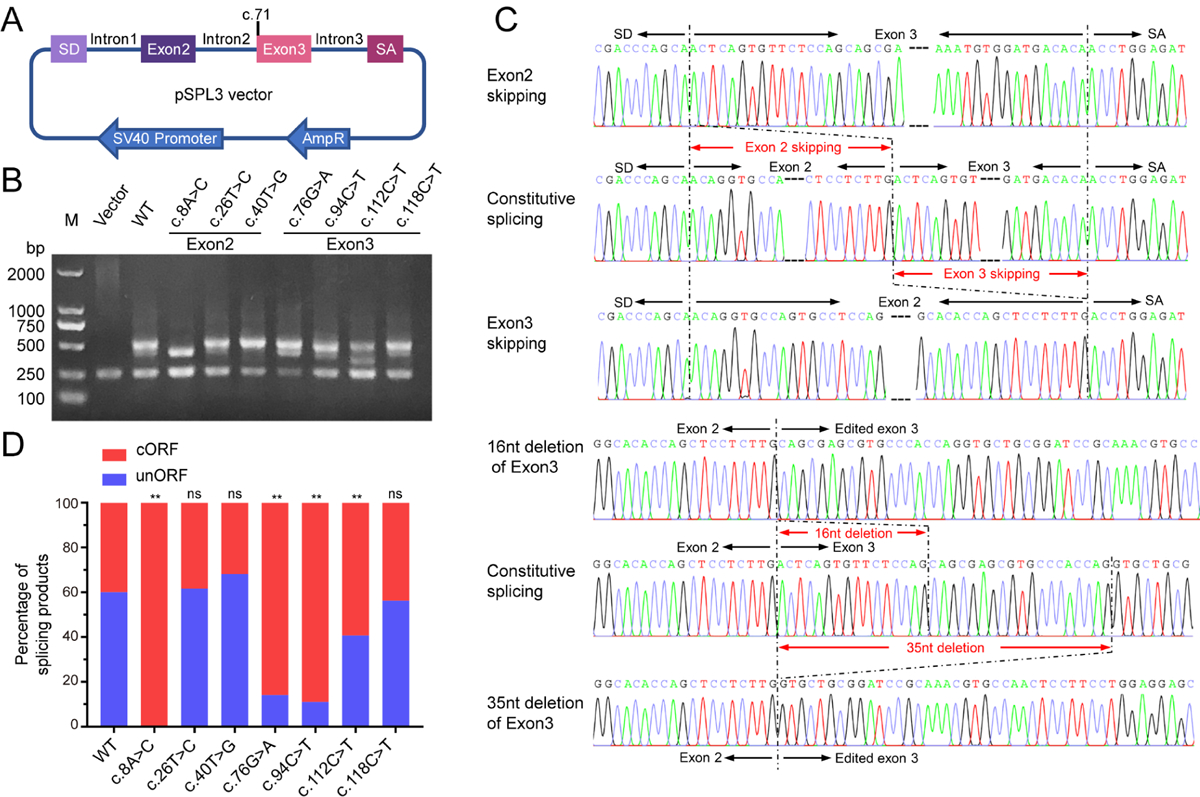
Figure 5. The effects of the PROC variations on the pre-mRNA splicing.

A. Scheme of the construct for minigene splicing assay. The genome sequence of PROC gene was sub-cloned into multi-cloning site (MCS) of pSPL3 vector. The c.71 indicates the position of the first nucleotide of exon 3. B. Agarose gel electrophoresis to analyzing the splicing products of PROC variations. The constructs were transiently transfected in HEK 293T cells. The splicing products were amplified by reverse transcriptase-PCR and analyzed by agarose gel electrophoresis. M indicates DNA ladder marker. Vector indicates splicing product from the empty pSPL3 vector. C. Comparison of sequencing chromatograms between constitutive and aberrant splicing products. Sequence changes were indicated by red arrow lines. D. Statistics of splicing products. About 100 sequencing results of each construct were analyzed. The splicing products were classified into two groups, changed ORF (cORF) and unchanged ORF (unORF). Percentage of each group was calculated. The cORF transcript cause non-functional protein product due to frame shift, and the unORF splicing products encode the normal PC. The Chi-square analysis is performed by Graphpad Prism 7. n.s. indicates no significant difference. * indicates p<0.05, and ** indicates p<0.01.
