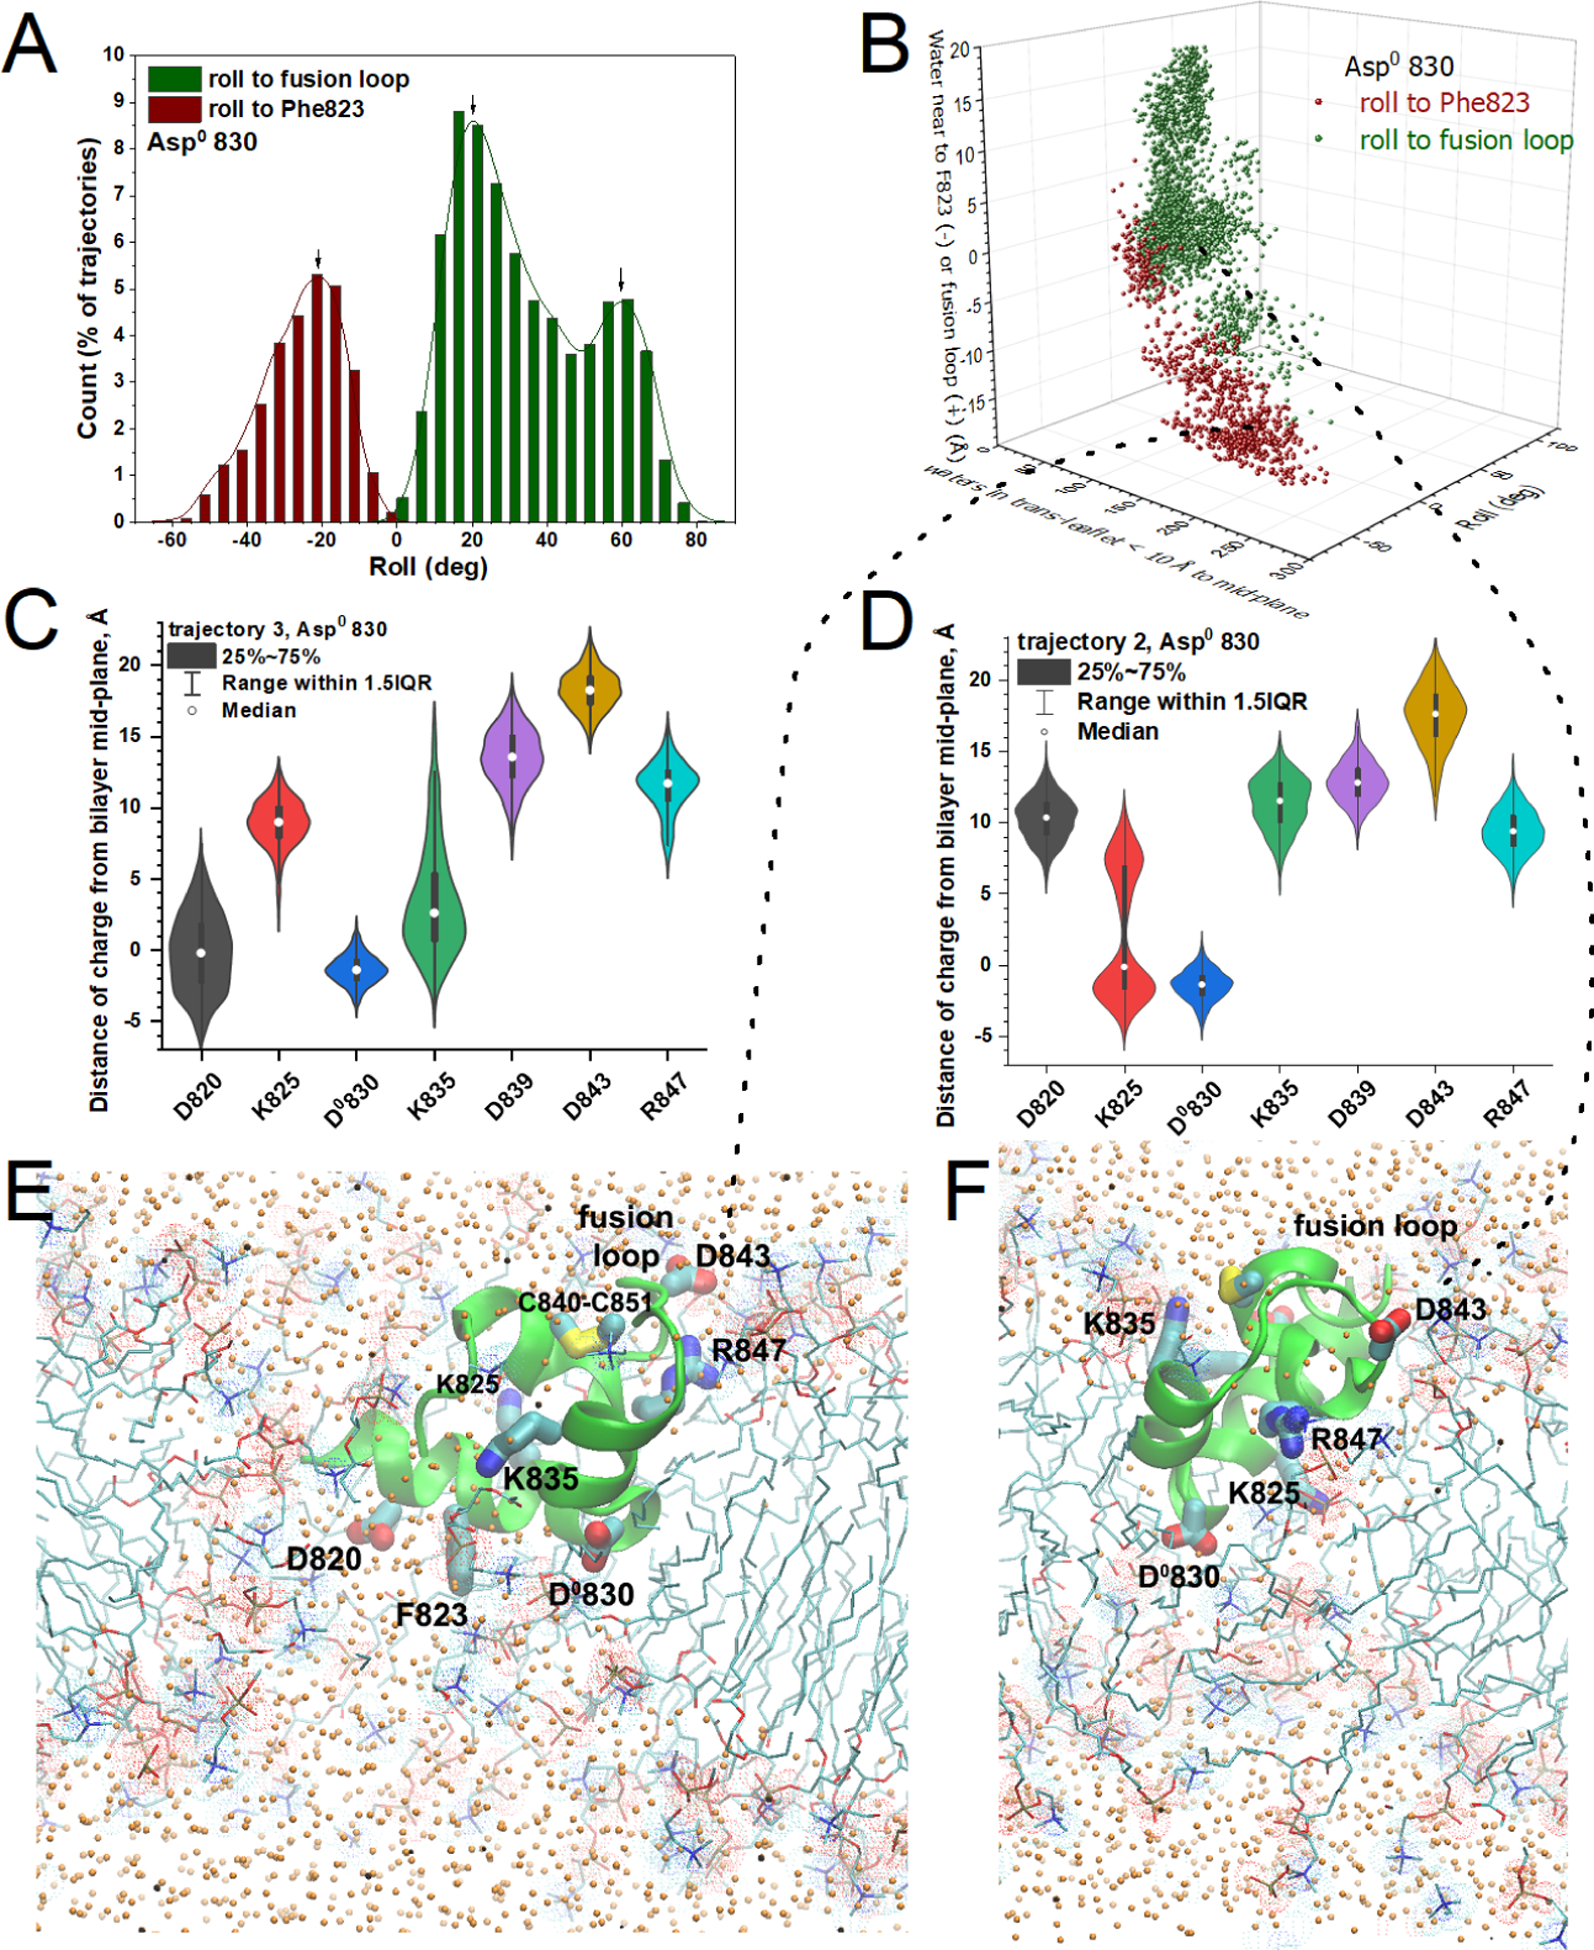
Figure 6. One or two charges rotated into the membrane with water on either side of FP in simulations with Asp830 neutralized.

(A) The histogram plots the frequency of roll of FP toward the fusion loop or Phe823 (from the LLF motif). (B) The roll of FP correlates with the side of FP where more water accumulated in the membrane. (C,D) The distributions of distances of charged groups from the center of the bilayer (violin plots with medians and interquartile ranges as in Fig. 5) suggest those groups that inserted into the DMPC bilayer in simulations that tilted toward Phe823 (C) or toward the fusion loop (D). (E) The snapshot of FP with the side of Phe823 rolled into the membrane is drawn from 133 ns into trajectory 3. (F) The snapshot of FP partly tilting toward the fusion loop is drawn from 136 ns into trajectory 2 as lipid flip-flop was taking place. Orange dots mark water oxygen atoms. Related to Figs. S7 – S9 and S15.
