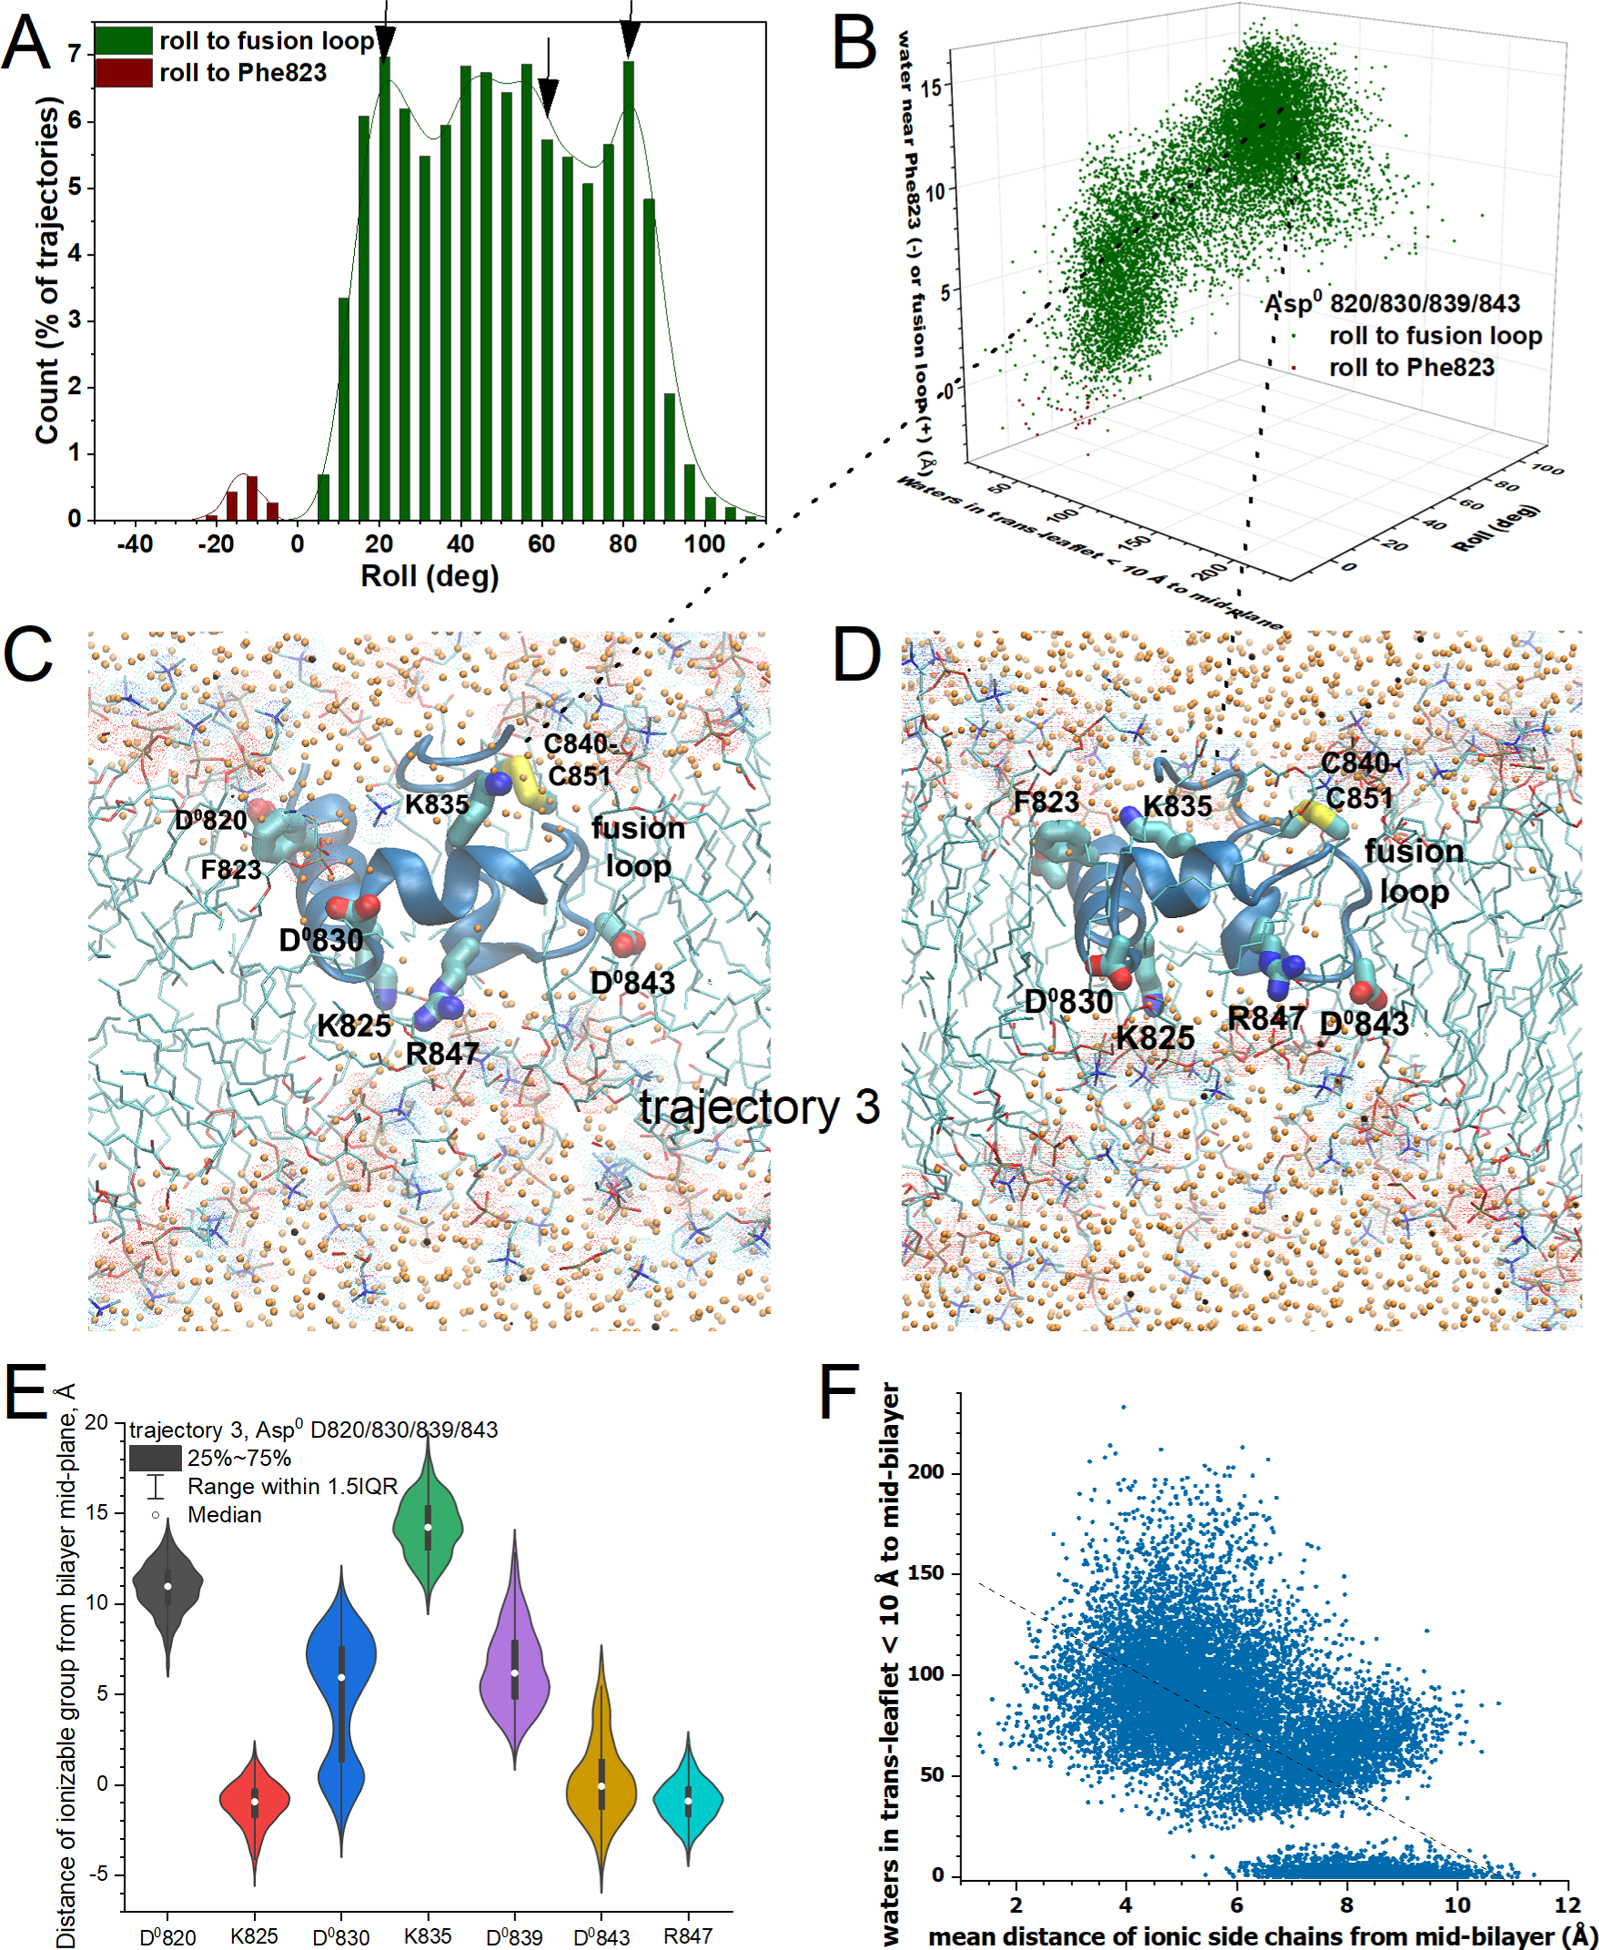
Figure 7. Simulations with neutralized aspartates, Asp0 820/830/839/843, rolled toward the fusion loop, rotating Lys825 and Arg847 into the DMPC bilayer with recruitment of water toward them.

(A) The histogram of frequency of roll orientations is plotted as in Figs. 5A, 6A. (B) Roll and location of center-of-mass of water recruited into the DMPC bilayer are plotted vs. waters recruited into the internal half of the trans-leaflet, as in Figs. 5C, 6B. (C, D) Snapshots are illustrated from the third Asp0 820/830/839/843 trajectory replicate, with rotations by 82° and 60° toward the fusion loop and recruitment of 82 and 120 waters, respectively (C,D), to the 10 Å interior slab of trans-leaflet. Sidechains of inserted basic and neutralized aspartic residues are labeled. (E) Violin plots show the distributions of the proximity of positive charges and neutralized carboxylate residues to the center of the bilayer for trajectory 3, including medians and interquartile ranges. (F) The number of water molecules counted in the trans-leaflet within 10 Å of the mid-plane of the DMPC bilayer is plotted against the mean distance to the mid-plane of the acidic or basic groups of the sidechains listed in panel (E). Related to Figs. S10 – S12 and S15.
