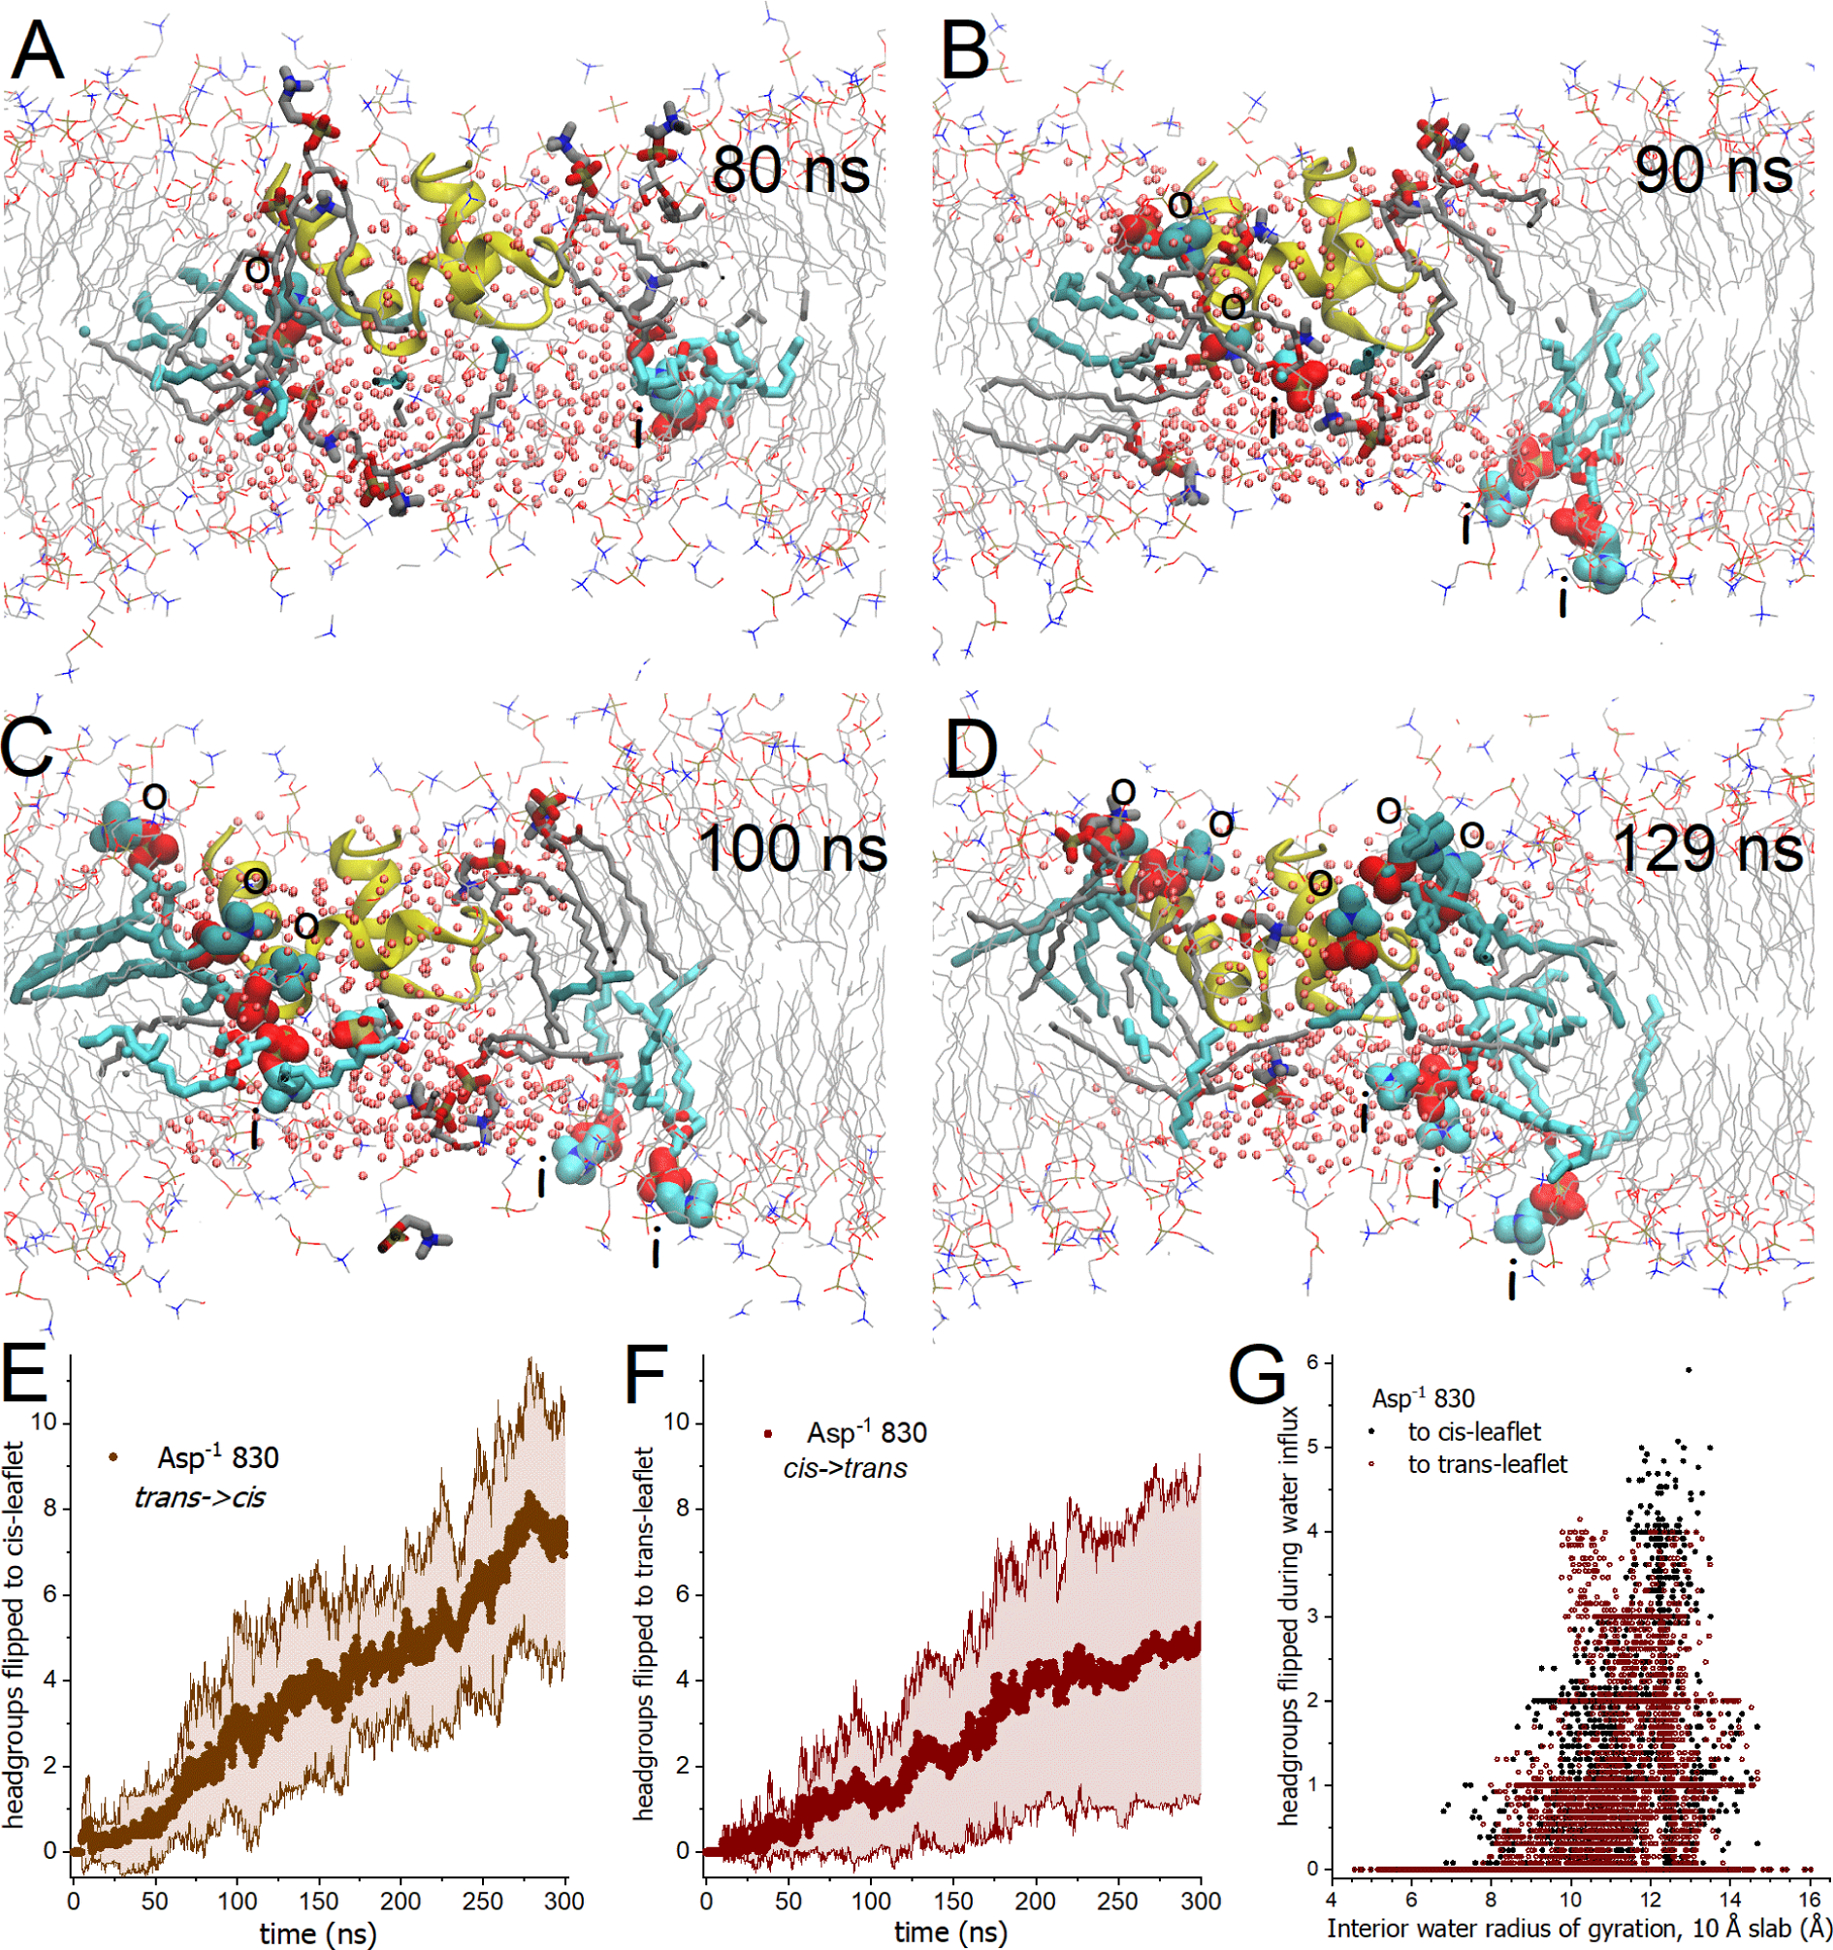
Figure 8. Flip-flop of DMPC proceeded bidirectionally through the transmembrane water jacket around FP.

(A–D) Snapshots of the Asp−1 830 state depict the progress of the initial flip-flops of DMPC from the trans to cis-leaflet (darker cyan, labeled “o”) and from the cis to trans-leaflet (lighter cyan, labeled “i”) during the 80 to 130 ns segment of trajectory 3. Affected DMPC molecules are plotted with heavy gray sticks prior to their flip-flop. Small pink spheres mark water oxygen atoms. FP (yellow) tilted toward the fusion loop. Movie S8 portrays the same events. (A) The first headgroup to emerge into the opposite leaflet (from both directions) is plotted. (B) Two DMPC molecules had flip-flopped from trans to cis, two from cis to trans, and another midway through a cis to trans flip-flop. (C) Three flip-flops had occurred in both directions. (D) Three DMPC had flip-flopped from cis to trans and five from trans to cis. (E–G) Headgroup atoms were counted as they crossed the mid-plane from one leaflet into the other leaflet. Counts of headgroup atoms are normalized by 13 atoms per choline headgroup. (E,F) Solid symbols mark represent the average of the five replicates of gently restrained simulations of the Asp−1 830 state for flip-flop trans to cis (E) and cis to trans (F). Confidence bands of ± 1σ are marked by shading thin lines. (G) Flip-flop of DMPC is plotted against the radius of gyration of the water within the central region of the bilayer (within 5 Å from the mid-plane) during initial influx of water into the bilayer and initial flip-flops, i.e., 0 – 85 ns of trajectories 1 to 4 and 0 – 180 ns of trajectory 5. Related to Movie S8 and Fig. S17.
