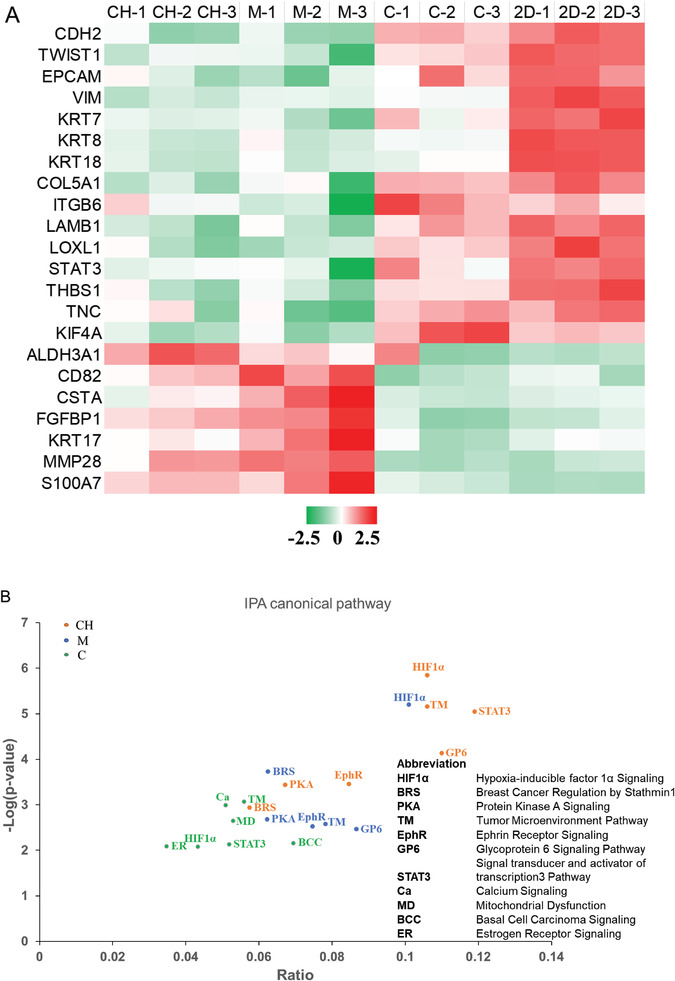
Figure 5.

Transcriptomic analysis of gene expression changes of 21PT cells cultured in three models as compared to 2D culture. A) Heatmap of representative EMT‐related genes in three models and 2D plate. The color code represents the row z‐score, where a red color indicates higher expression of a gene, while a green color indicates lower expression of a gene. B) Canonical pathway identified by IPA showed similar enrichment between 21PT cells cultured in Matrigel and CH models but different from cells cultured in the collagen model.
