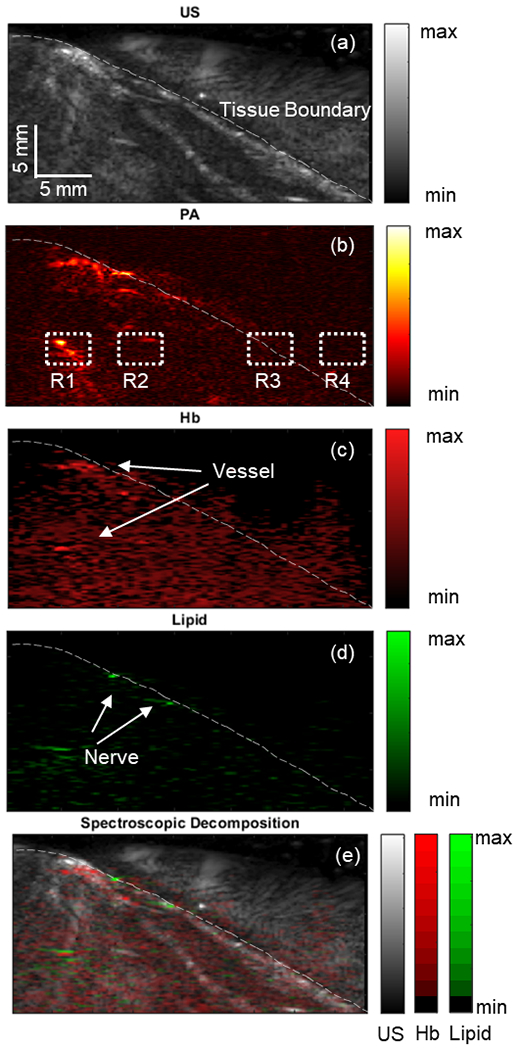
Fig. 11.

Illustrates the scanned ex vivo rat thigh using (a) ultrasound (US) and (b) spectroscopic photoacoustic (sPA) imaging at 700 nm. The dotted section was selected to measure the signal-to-noise ratio (SNR). The white dashed line marks the tissue boundary. The distribution maps of hemoglobin (Hb) (c) and lipid (d) contrasts are shown. (e) An overlaid image of different contrast distributions mapped onto the US images.
