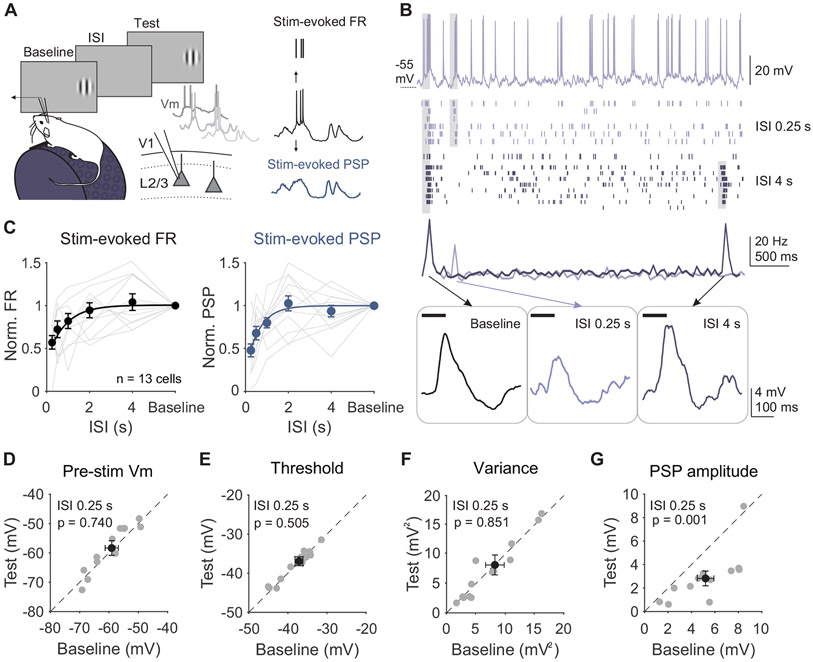
Figure 1. Adaptation suppresses stimulus-evoked responses in L2/3 neurons without affecting cell-intrinsic properties.
A. Left: Recording setup and stimulus paradigm. Animals are head-fixed on a treadmill and membrane potential (Vm) of L2/3 neurons is recorded with a glass pipette. Two stimuli (baseline and test; 0.1 s) are separated by an inter-stimulus interval (ISI) varying from 0.25 to 4 s. Right: Membrane potential is separated into the stimulus-evoked firing rate (black) and stimulus-evoked post-synaptic potential (blue; PSP). B. Top: Membrane potential from an example cell during a 0.25 s ISI trial. Grey shading indicates stimulus presentation. Middle: Raster plot of spike output during 0.25 s (light purple) and 4 s (dark purple) ISI trials and binned peri-stimulus spike histogram (PSTH). Bottom: Same example cell’s trial-averaged subthreshold membrane potential during baseline (left) and test stimulus presentations at 0.25 s (middle) and 4 s (right) ISIs. C. Left: Average normalized firing rate (FR; test/baseline) as a function of ISI for individual cells (gray lines) and all cells (black circles; n=13). Error is SEM across cells. Black line is an exponential fit (τ=0.82 s). Right: Same as left, for average normalized PSP amplitude (τ=0.79 s). D. Average membrane potential preceding baseline and test stimuli for individual cells in 0.25 s ISI trials. Black dot is mean across cells. Error is SEM across cells. E-G. Same as D for spike threshold (E), membrane variance (F), and PSP amplitude (G). See also Figure S1.

