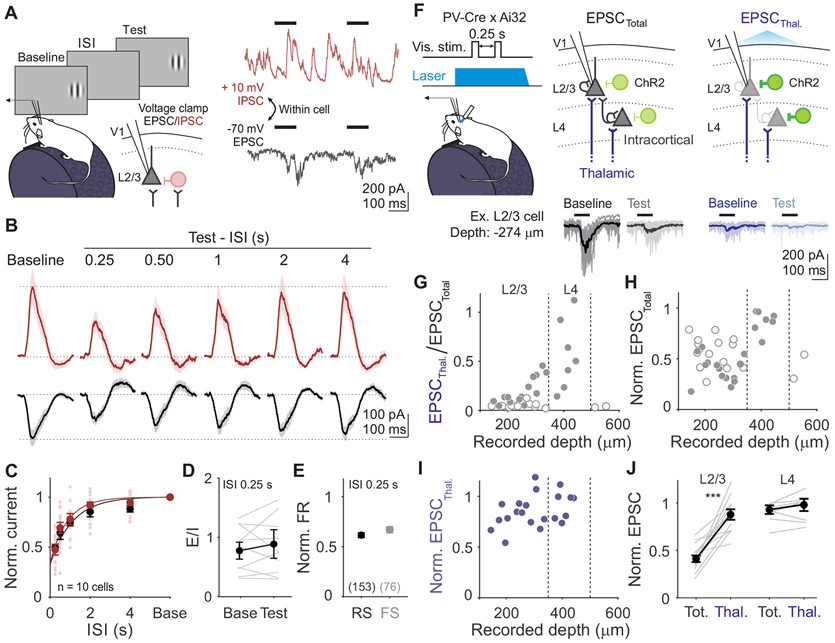
Figure 2. Adaptation drives a balanced reduction of intracortical stimulus-evoked excitation and inhibition.
A. Left: Schematic of recording setup for measuring excitatory and inhibitory currents (EPSCs and IPSCs) in L2/3 neurons. Right: Single trial voltage traces from an example cell held at −70 mV (black) and +10 mV (red), to measure EPSCs and IPSCs respectively. B. Stimulus-evoked EPSCs and IPSCs averaged across all cells (n=10) in response to baseline and test stimuli for all ISIs. Shaded error is SEM across cells. C. Average normalized current amplitudes (test/baseline) for EPSCs (black) and IPSCs (red) for individual cells (small dots) and across all cells (large dots). Curve is exponential fit to the average across cells for each current type (τEPSC=1.10 s; τIPSC=0.93 s). Error is SEM across cells. D. Ratio of excitation to inhibition (E/I) for the baseline and test stimulus in 0.25 s ISI trials. Grey lines are individual cells, black line is average across cells, error is SEM across cells. E. Comparison of visual adaptation in 0.25 s ISI trials in putative pyramidal cells (RS, black) and inhibitory interneurons (FS, gray), obtained from extracellular recordings. Error is SEM across units. F. Top: Schematic of cortical silencing for isolating thalamic excitatory input: photostimulation of ChR2 (green) in parvalbumin (PV)-expressing inhibitory interneurons. Bottom: Stimulus-evoked EPSCs recorded in an example neuron during control (EPSCTotal) and cortical silencing (EPSCThal.) trials. Thin lines are individual trials, thick lines are trial-averaged response. G. Fraction of remaining thalamic current (EPSCThal./EPSCTotal) as a function of cell depth from pia. Vertical dashed lines are depth boundaries used for layer identification. Filled and empty circles are cells with (n=21) and without (n=17) detectable thalamic input, respectively. H. Same as G, but normalized current amplitude of EPSCTotal (test/baseline). I. Same as G, but normalized current amplitude of EPSCThal. (test/baseline). Only cells with thalamic input are included. J. Comparison of normalized EPSC (test/baseline) measured from total versus thalamic input in L2/3 (left) and L4 (right) cells. Grey lines are individual cells and black line is average across cells. Error is SEM across cells. See also Figures S2-3.

