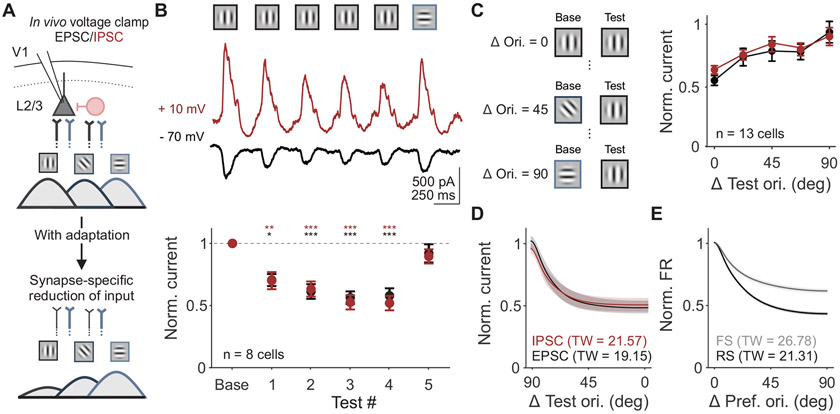
Figure 3. Changes in synaptic input are selective to previously activated synapses.
A. Schematic of proposed model of synapse-specific effect of adaptation on excitatory inputs from L4 to L2/3. Color of axons correspond to L4 inputs to L2/3 synapses tuned to vertical (black) versus horizontal (blue) orientations. Line thickness represents strength of inputs. B. Top: Visual stimulus paradigm with repeated presentation of the same stimulus orientation (baseline and test 1-4) followed by an orthogonal orientation (test 5). Middle: Trial-averaged stimulus evoked EPSCs (black) and IPSCs (red) for an example cell. Bottom: Average normalized current (test/baseline) for all cells (n=8). Response to the orthogonal orientation is normalized to its own baseline. Error is SEM across cells. C. Left: Schematic of stimuli presented to measure the tuning width of adaptation. Test orientation was kept constant while the baseline orientation varied. Right: Average normalized current (test/baseline, where the baseline is the same orientation as the test) as a function of similarity between baseline and test stimuli for EPSCs and IPSCs for all cells (n=13). D. Average adaptation tuning curve fits from data in C. Shaded error is SEM across cells. Tuning width (TW) is half-width at half-max. E. Average orientation tuning curve fits from extracellular recording of RS (black) and FS (gray) units. See also Figure S3.

