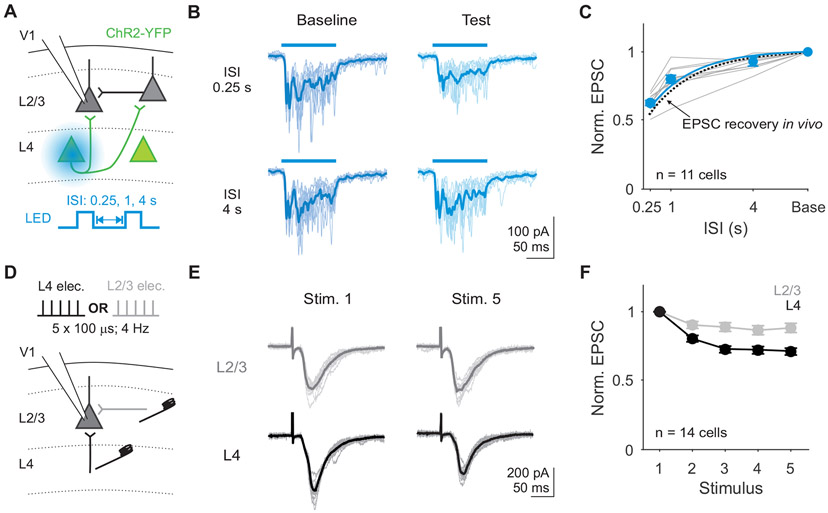
Figure 4. Excitatory inputs to L2/3 neurons decrease with repeated stimulation in vitro.
A. Schematic of setup for recording EPSCs in L2/3 neurons during optogenetic stimulation of L4. Two 0.1 s square pulses of blue light (baseline and test) were used to activate L4 neurons. B. Traces during baseline (dark blue) and test (light blue) stimuli from an example cell during 0.25 s (left) versus 4 s (right) ISI trials. Thin lines are individual trials, thick lines are trial-averaged response. C. Average normalized EPSC amplitudes (test/baseline) as a function of ISI for each cell (gray) and the across all cells (blue). Blue line is exponential fit to the average across cells (τ=1.03 s). Dashed line is exponential fit from EPSCs recorded in vivo in Figure 2. Error is SEM across cells (n=11). D. Schematic for recording EPSCs from a L2/3 pyramidal cell while electrically stimulating L4 or L2/3 inputs on alternating trials. E. EPSCs from an example cell in response to stimulation of L2/3 (top; gray) or L4 (bottom; black). Thin lines are individual trials, thick lines are trial-averaged response. F. Average EPSC amplitudes normalized to the first stimulus in response to L2/3 (gray) and L4 (black) stimulation. Error is SEM across cells. See also Figure S4.

