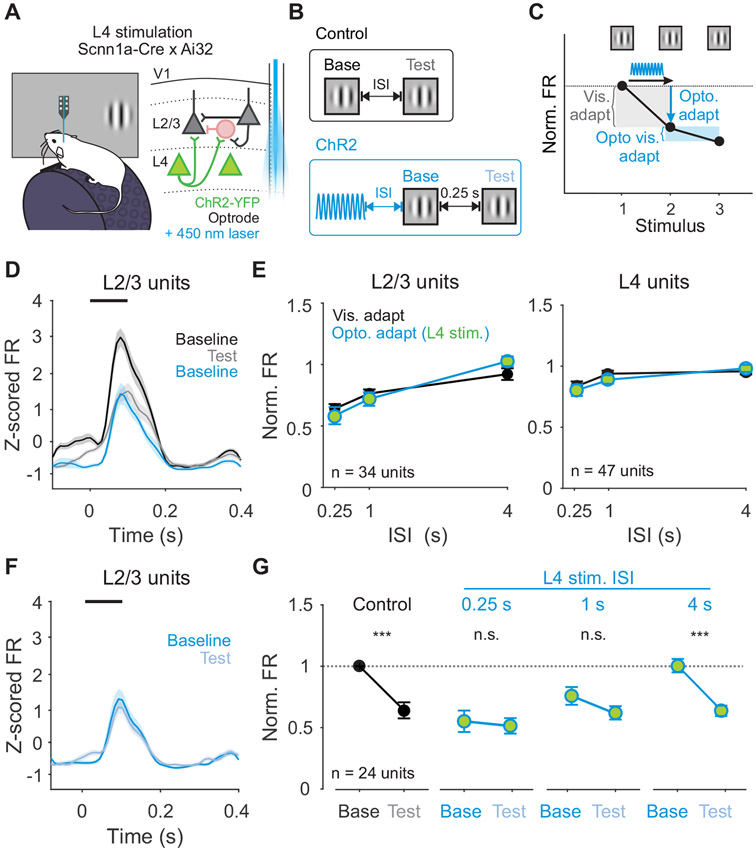
Figure 5. Activation of L4 neurons is sufficient to recapitulate the effects of visual adaptation.
A. Schematic of in vivo extracellular recording setup with optrode. B. Structure of control trials (black) and ChR2 activation trials (blue). On control trials, baseline and test stimuli are presented with varying ISI. On ChR2 activation trials, 0.5 s of sinusoidal (20 Hz) blue light is used to activate L4 neurons optogenetically at varying intervals prior to baseline visual stimulus presentation. C. Visual adaptation is quantified as the response to the test divided by the response to the baseline stimulus (gray shaded box). Optogenetic adaptation is quantified as the response to the baseline stimulus in ChR2 activation trials divided by the response to the baseline stimulus in control trials (blue arrow). Optogenetic visual adaptation is quantified as the response to the test stimulus divided by the baseline stimulus on ChR2 activation trials (blue shaded box). D. Average z-scored PSTH for L2/3 units during baseline (black) and test (gray) stimuli in control trials and baseline stimulus in ChR2 activation trials (blue; n=34 units). Black line indicates stimulus presentation. Shaded error is SEM across units. E. Comparison of visual adaptation (black) and optogenetic adaptation (blue) in L2/3 (left) and L4 (right) units. Green fill indicates optogenetic stimulation of L4. F. Average z-scored PSTH for L2/3 units during baseline (blue) and test (light blue) stimuli in L4 ChR2 activation trials. G. Visual adaptation (black) and Optogenetic visual adaptation (blue) with 0.25 s ISI at increasing intervals after L4 stimulation (0.25 s, 1 s, 4 s). Normalized firing rate is calculated relative to baseline visual response in control trials (horizontal dashed line). Error is SEM across units. See also Figures S5-6.

