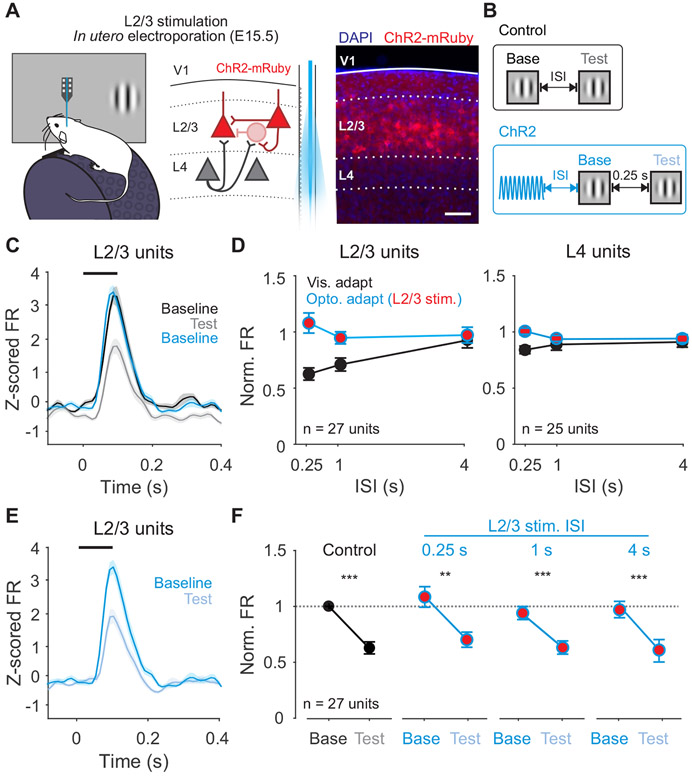
Figure 6. Activation of L2/3 neurons does not recapitulate the effects of visual adaptation.
A. Left: Schematic of in vivo extracellular recording setup in mice expressing ChR2 in L2/3 neurons. Right: expression of ChR2-mRuby in L2/3 neurons following in utero electroporation. Scale bar is 100 μm. B. Structure of control trials (black) and ChR2 activation trials (blue). C. Average z-scored PSTH for L2/3 units during baseline (black) and test (gray) stimuli in control trials and baseline stimulus in ChR2 activation trials (blue; n=27 units). Black line indicates stimulus presentation. Shaded error is SEM across units. D. Comparison of visual adaptation (black) and optogenetic adaptation (blue) in L2/3 (left) and L4 (right) units. Red fill indicates optogenetic stimulation of L2/3. E. Average z-scored PSTH for L2/3 units during baseline (blue) and test (light blue) stimuli in L2/3 ChR2 activation trials. F. Visual adaptation (black) and Optogenetic visual adaptation (blue) with 0.25 s ISI at increasing intervals after L2/3 stimulation (0.25 s, 1 s, 4 s). Normalized firing rate is calculated relative to baseline visual response in control trials (horizontal dashed line). Error is SEM across units. See also Figure S5.

