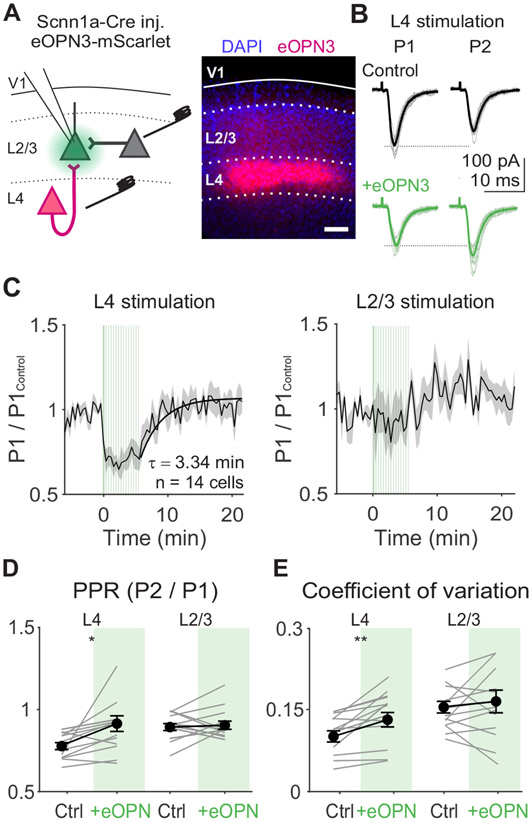
Figure 7. Activation of eOPN3 in L4 terminals reduces probability of release at inputs onto L2/3 neurons.
A. Left: Schematic of in vitro recording setup for recording EPSCs in L2/3 neurons while electrically stimulating L4 or L2/3. eOPN3 expressed in L4 neurons is activated with green light over L4 terminals in L2/3. Right: Example image of viral expression pattern. Scale bar is 100 μm. B. EPSCs from an example cell in response to L4 stimulation during first (P1) and second (P2) stimuli in a train (4 Hz), either before (black) or after eOPN3 activation (green). Thin lines are individual trials, thick lines are trial-averaged response. C. Average time course of normalized P1 EPSC amplitudes following L4 (left) or L2/3 (right) stimulation aligned to the time of eOPN3 activation (n=14 cells). Vertical green lines indicate eOPN3 activation trials: induction of 10 s of pulsed green light prior to visual stimulus presentation, followed by a top-up of 0.5 s of pulsed green light prior to each trial. Black curve is exponential fit to recovery (τ=3.34 min). Shaded error is SEM across cells. D. Paired pulse ratio (PPR) during L4 or L2/3 stimulation for individual cells (gray lines) and the average of all cells (black) in control (white) and after eOPN activation (green). Error is SEM across cells. E. Same as D, for coefficient of variation.

