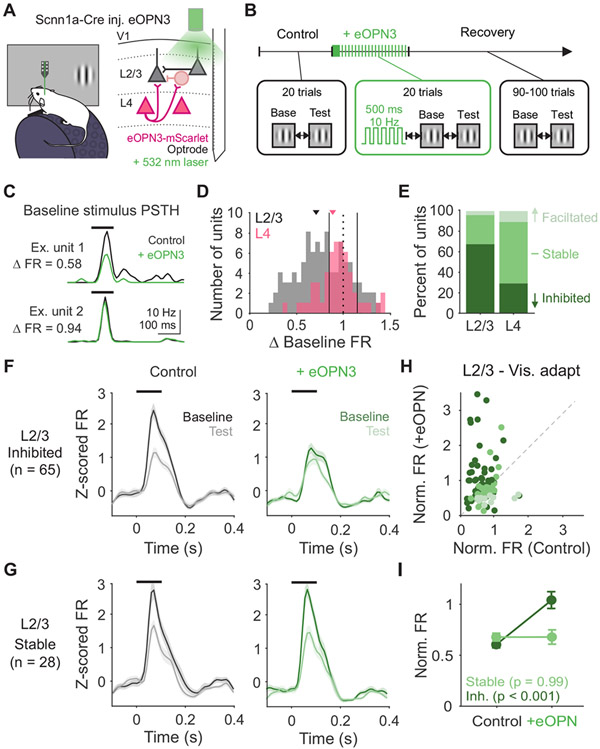
Figure 8. Decreasing probability of release at L4 terminals decreases visual adaptation in vivo.
A. Schematic of recording setup and eOPN3 expression. B. Block-wise trial structure for measuring effects of eOPN3 activation on visual adaptation. Visual stimuli are always presented with 0.25 s ISI. C. PSTHs for two example units in control (black) and eOPN3 activation (green) trials. ΔFR is calculated as the change in peak stimulus-evoked response. D. Distribution of change in visually-evoked responses to the baseline stimulus in L4 (pink; n=61) and L2/3 (gray; n=105) units. Vertical solid lines indicate thresholds for categorization as inhibited (<0.8), stable (≥0.8 and ≤1.2), or facilitated (>1.2). E. Percent of units categorized as inhibited, stable, or facilitated in L2/3 and L4. F. Average z-scored PSTH of inhibited L2/3 units (n=65) in response to baseline (dark) and test (light) stimuli during control trials (left, black) and during eOPN3 activation trials (right, green). Black line indicates stimulus presentation. Shaded error is SEM across units. G. Same as F, for stable L2/3 units (n=28). H. Comparison of normalized response (test/baseline) in control and eOPN3 activation trials, for all L2/3 units colored by categorization in E. I. Average normalized response for inhibited (dark green) and stable (light green) units in L2/3. Error is SEM across units. See also Figures S5, 7 and 8.

