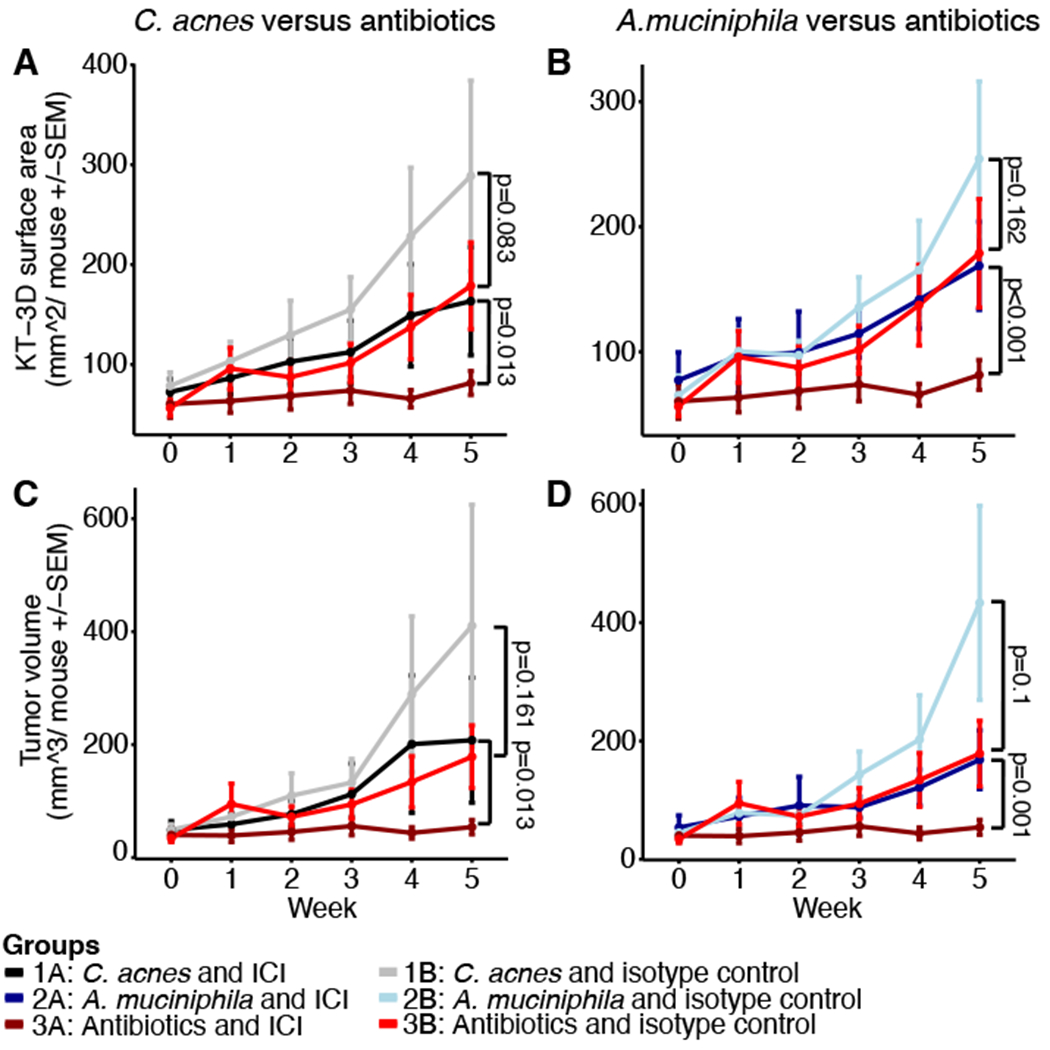
Figure 3: Tumor surface area and volume.

A and C: Depicted are the KT3D tumor surface area and B and D tumor volume for the C. acnes (Group 1, A, B) and A. muciniphila (Group 2, C, D) treated groups compared to the antibiotic-treated mice (Group 3). Week 0 represents the first week of tumor measurement (enrollment), week 1 pre-antibiotics treatment and weeks 2-5 bacteria/antibiotics as well as ICI/isotype treatment with euthanasia at the end point (week 5). P-values were calculated using linear modeling and repeated measure ANOVA including the weeks 3, 4 and 5 (details in Supplementary Materials and Methods, full list of p-values in Table S4). Depicted are all mice per group irrespective of sex: Group 1A: n=8, Group 1B: n=9, Group 2A: n=9, Group 2B: n=9, Group 3A: n=8, Group 3B: n=8.
