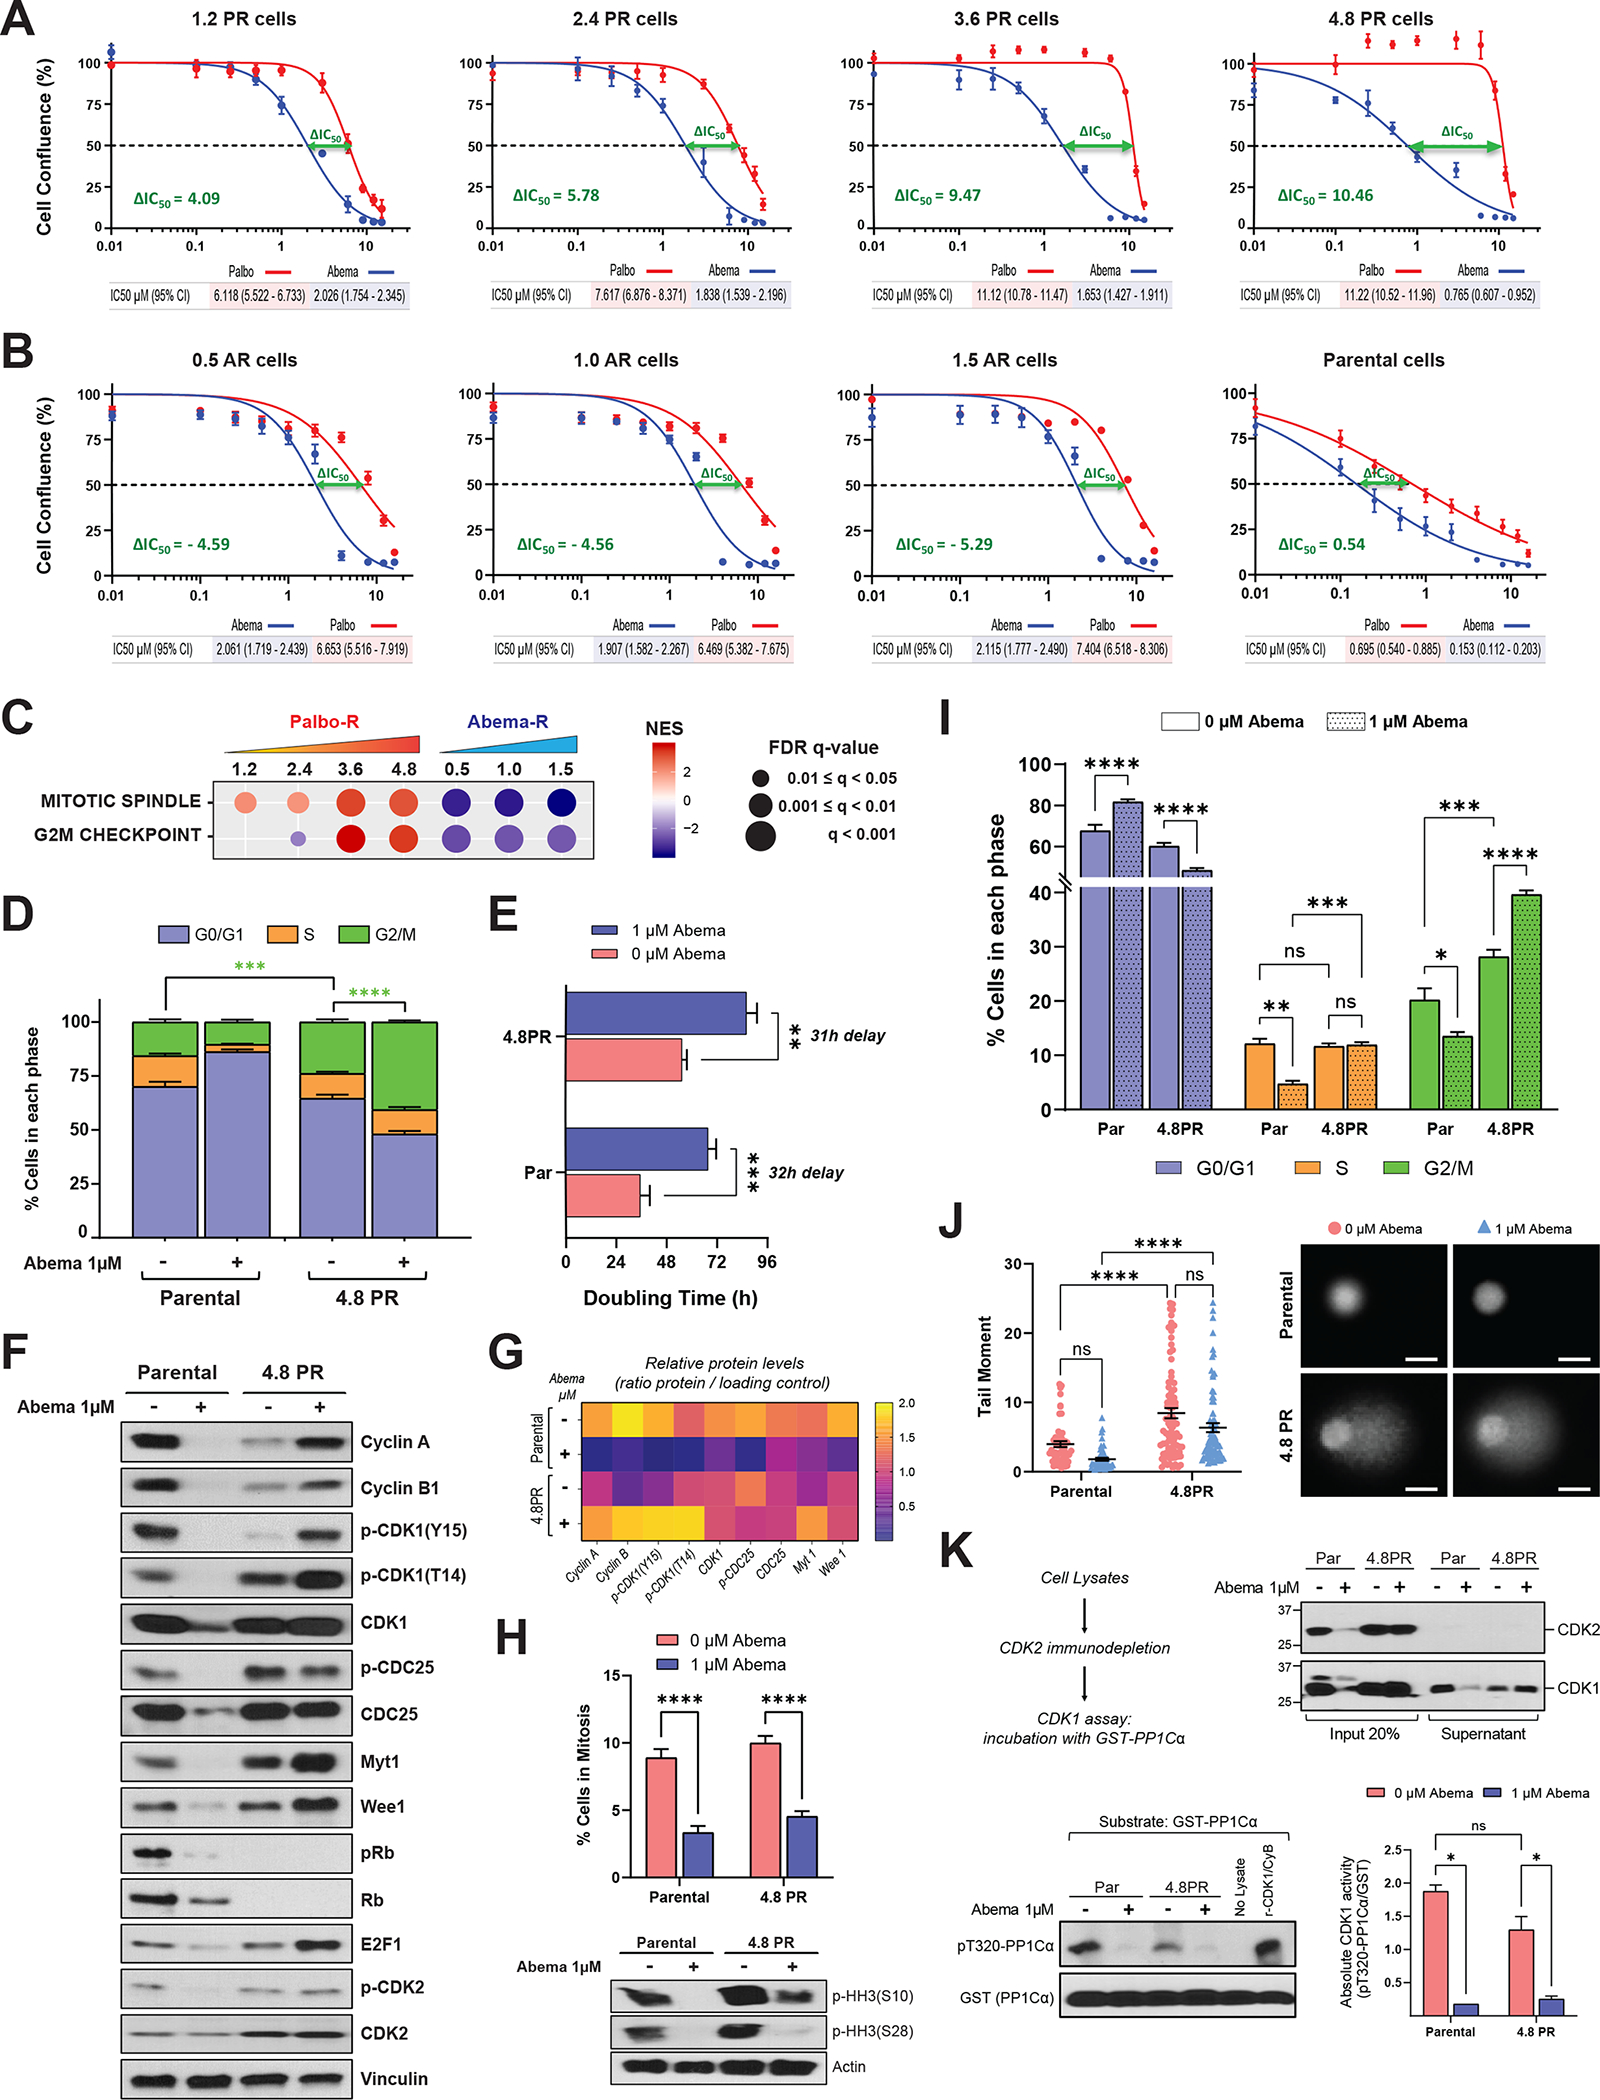
Figure 3. Abemaciclib induces G2 arrest and overrides entry into mitosis in PR cells.

A and B, Dose-response curves in MCF7 PR (A), AR (B), and parental (B) cells depicting the effect of treatment with increasing concentrations of abemaciclib or palbociclib (0.01–16 μM) for 6 days, followed by 6 days of recovery in drug–free medium. As a readout of cell proliferation, cell confluence (whole well) was assessed using Incucyte. Data were normalized to DMSO (100%), plotted, and analyzed by nonlinear regression using GraphPad Prism 9 software. Each experiment included eight biological replicates per concentration and was repeated at least 3 times. Data represent the mean ± SEM; n ≥ 3 independent experiments. The IC50 values are indicated by the dashed line and specified below each plot including the 95% CI. The difference between the IC50 values for palbociclib and abemaciclib, or ΔIC50, was calculated by subtracting the IC50 of the tested drug from the IC50 of the drug to which the cells were resistant: For PR cells, ΔIC50 = (IC50 palbociclib − IC50 abemaciclib); for AR cells, ΔIC50 = (IC50 abemaciclib − IC50 palbociclib). The ΔIC50 is indicated in each plot. C, GSEA of two cancer hallmark gene sets, mitotic spindle and G2/M, in MCF7 PR and AR cells (see Fig. 1G). FDR, false discovery rate; NES, normalized enrichment score. D, Cell cycle analysis in MCF7 parental and 4.8PR cells comparing the effect of treatment with 1 μM abemaciclib for 6 days. Stacked bars represent the percentage of cells in each cell cycle phase. The difference in the percentages of cells in G2/M phase between the indicated groups was evaluated by two-way ANOVA, Tukey’s multiple comparisons test. *** P = 0.0003; **** P < 0.0001. Data represent the mean ± SEM; n ≥ 4 independent experiments. E, Bar graph depicting the effect of 1 μM abemaciclib treatment for 6 days on the doubling time of MCF7 parental and 4.8PR cells. Cells were counted on day 0 and on day 6, after treatment. The difference between groups was evaluated by two-way ANOVA, Šídák’s multiple comparisons test. ** P = 0.0010; *** P = 0.0004. Data represent the mean ± SEM; n ≥ 4 independent experiments. F, Western blot analysis of the indicated proteins in MCF7 parental and 4.8PR cells treated with 1 μM abemaciclib for 6 days. G, Densitometry analysis for the western blots in F showing the average protein levels (ratio for each protein/loading control) of three independent experiments. H, Top: Percentage of MCF7 parental and 4.8PR cells in mitosis after treatment with 1 μM abemaciclib for 6 days evaluated by flow cytometry. The percentage of cells in mitosis was determined by quantitation of histone H3 phosphorylated at S28 (pHH3-S28) in parallel with DNA content (propidium iodide) to evaluate the cell cycle. Percentage of cells in mitosis = (cells in mitosis / cells in G2/M) × 100. The difference between groups was evaluated by two-way ANOVA, Dunnett’s multiple comparisons test. **** P ≤ 0.0001. Bottom: Western blot analysis of pHH3 (phosphorylated at S28 and S10) using cell lysates from two independent representative experiments with MCF7 parental and 4.8PR cells treated under the same conditions. I, Percentages of cells gated in each cell cycle phase according to the DNA content (measured by propidium iodide) from the experiments in H. Multiple comparisons were evaluated by two-way ANOVA, Tukey’s multiple comparisons test. * P = 0.0139; ** P = 0.0052; *** P ≤ 0.0007; **** P ≤ 0.0001; ns: not significant. Data represent the mean ± SEM; n ≥ 4 independent experiments. Cell cycle experiments in I are independent from those in D. J, DNA damage in MCF7 parental and 4.8PR cells upon 1μM abemaciclib treatment for 6 days evaluated by comet assay. Representative images of different conditions are shown. Images were captured using 20× magnification. Bars = 25 μm. Cells were scored using the Comet Assay Software Project (CASP) tool; 50–100 cells were scored per condition per independent experiment. Each experiment included two biological replicates per concentration and was repeated twice. Data are representative of one independent experiment and depict the tail moment mean ± SEM. Tail moment = percentage of DNA in the tail × tail length. The difference between groups was evaluated by two-way ANOVA, Šídák’s multiple comparisons test. **** P ≤ 0.0001; ns: not significant. K, In vitro CDK1 kinase activity measured by quantitation of the phosphorylation levels on T320 of the substrate protein phosphatase 1Cα (pT320-PP1Cα). Top left: Experimental flow chart. Top right: Western blot analysis with both CDK2 and CDK1 antibodies showing the presence of CDK1 after immunodepletion of CDK2. Bottom left: CDK2-immunodepleted lysates were incubated with recombinant GST-PP1Cα and assayed for pT320-PP1Cα by western blot analysis. Recombinant CDK1/cyclin B (CyB) complex was used as a positive control. Bottom right: Bar graph shows absolute in vitro CDK1 activity quantified as the ratio of pT320-PP1Cα to GST from two independent experiments. Densitometry analysis was performed using ImageJ software. The difference between groups was evaluated by two-way ANOVA, Tukey’s multiple comparisons test. * P < 0.05; ns: not significant.
