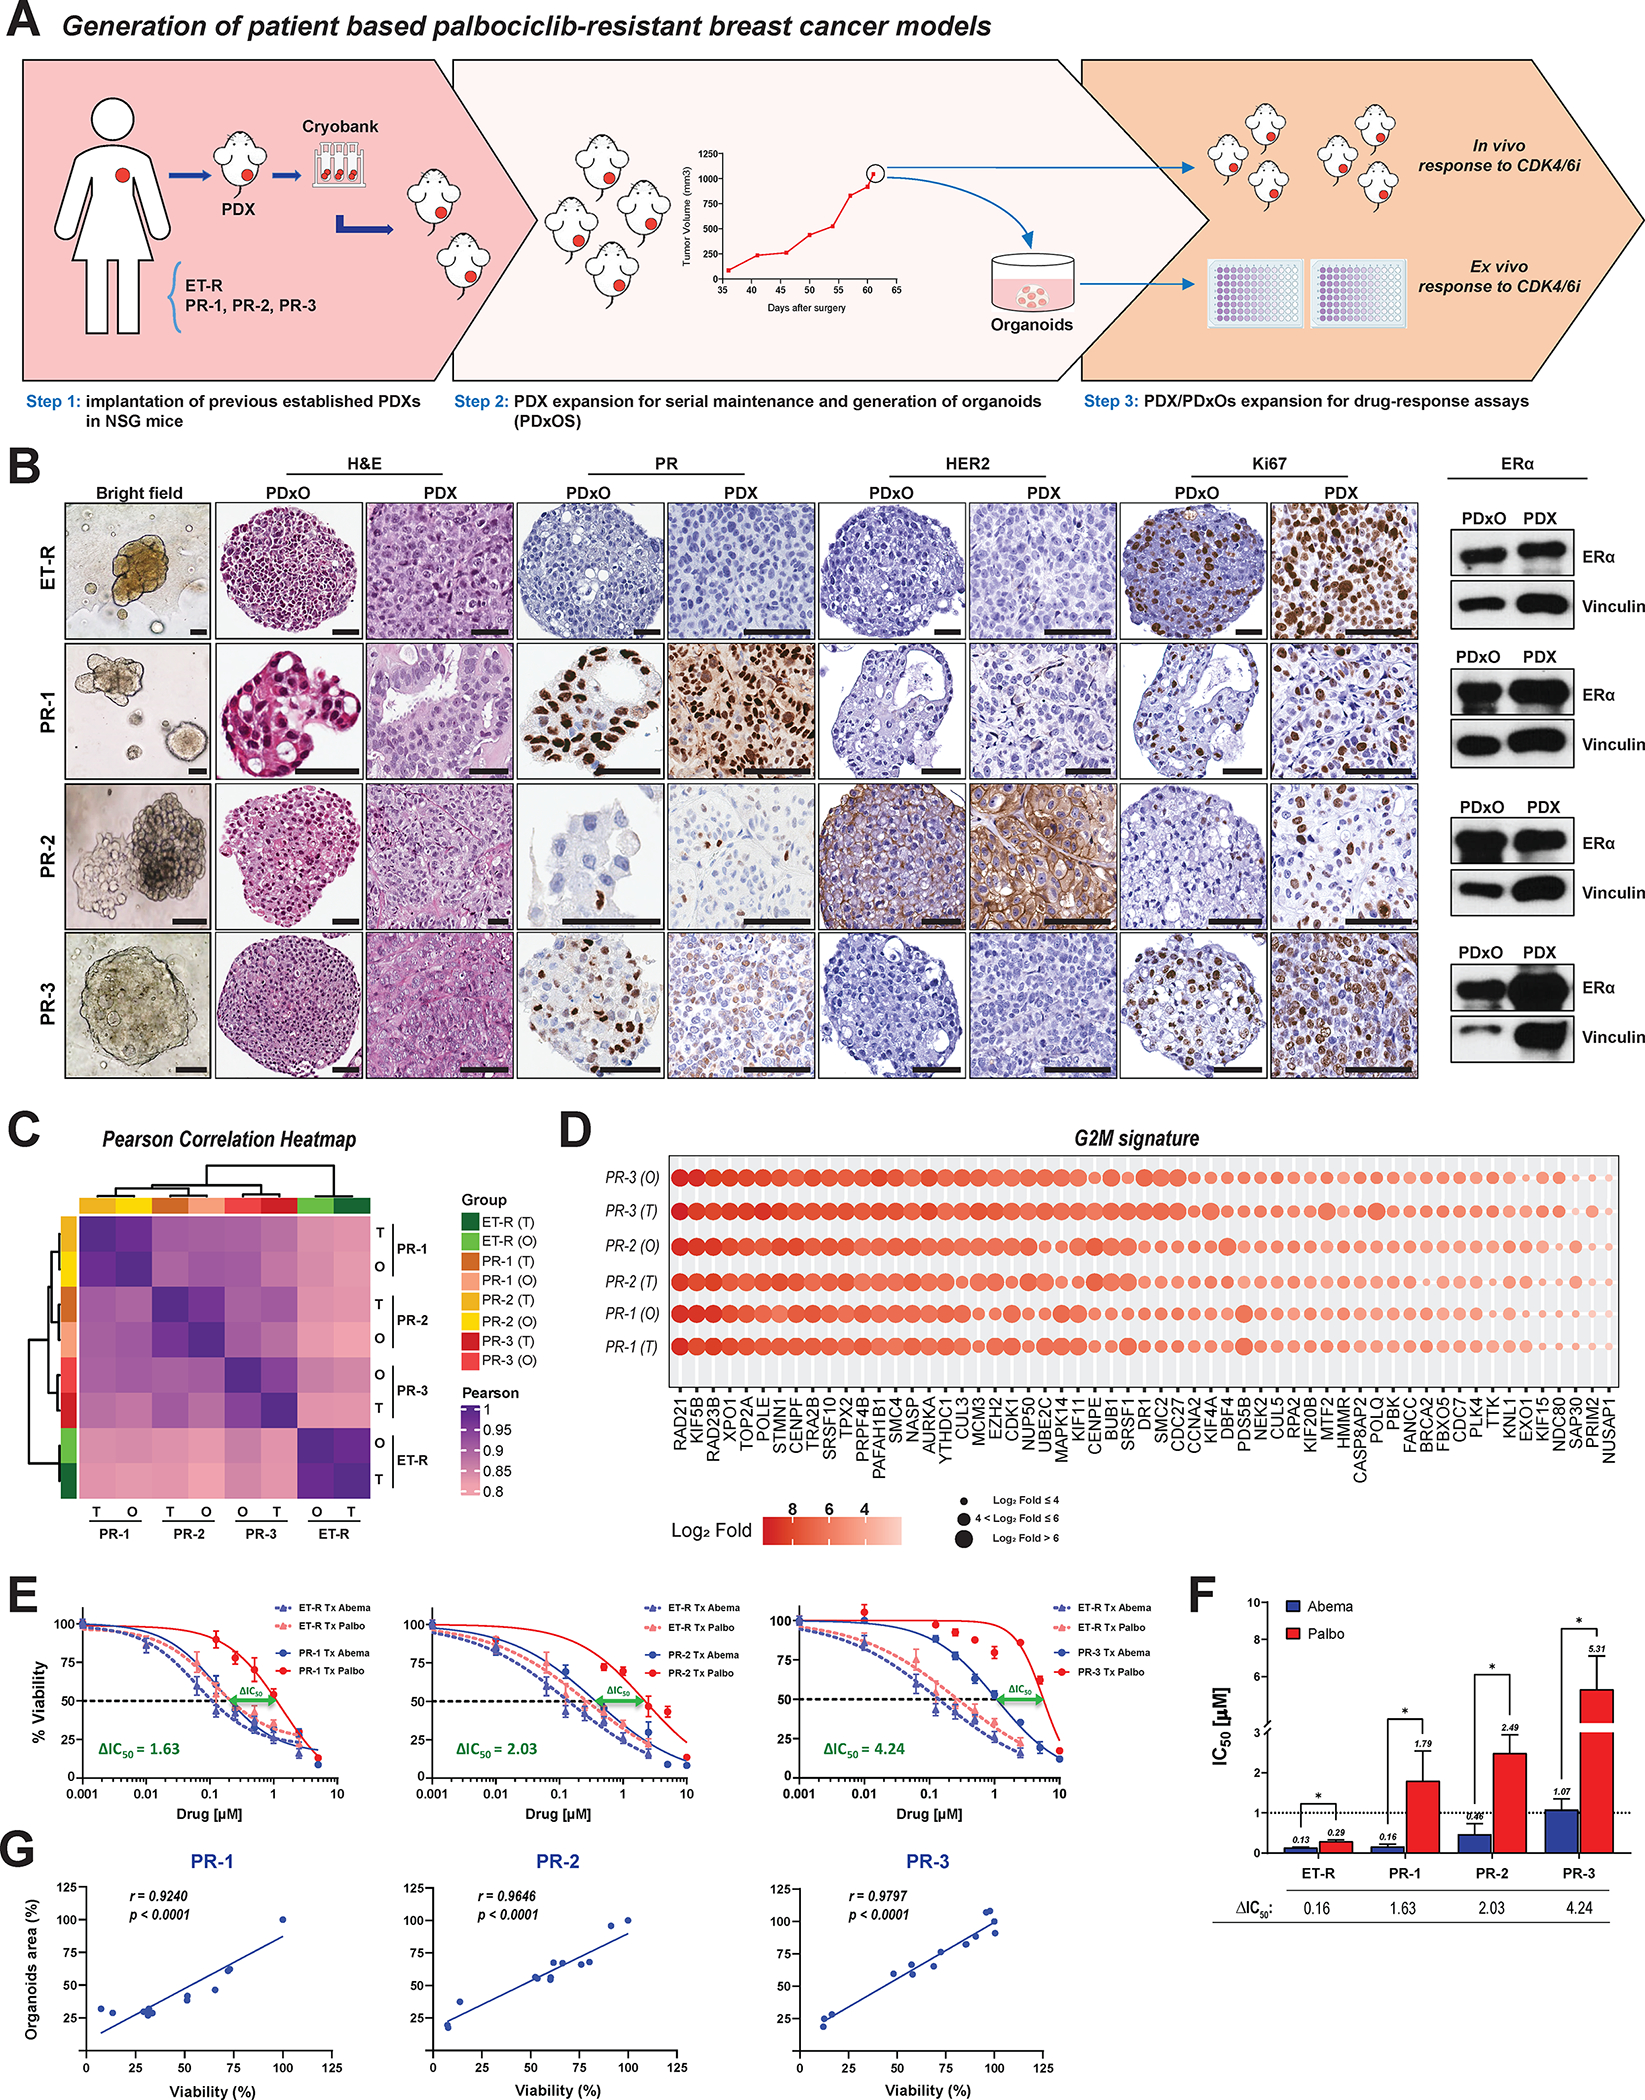
Figure 4. Patient-derived palbociclib resistant breast cancer models retain abemaciclib sensitivity.

A, Schema for establishing human PDXs and long-term organoid cultures from PDXs (PDxOs). See Supplementary Fig. S8A for additional details on the PDX models. B, Morphological and histological characterization of matched PDxOs and PDXs. First column: Bright-field images (20× magnification) from the four PDxO models depicting the organoid phenotypes. ET-R and PR-3 had cohesive, dense/solid organoids; PR-1 had cohesive organoids, with a mix of cystic/hollow and dense/solid organoids; and PR-2 had discohesive organoids. Second and third columns: H&E staining comparing the histopathological features of PDxOs and their matched PDXs. PDxOs show a tissue architecture/organization reminiscent of the original PDX lesions, high-grade adenocarcinoma. ET-R, PR-1, and PR-2 exhibited some areas forming tubular gland structures, while PR-3 exhibited marked nuclear atypia and mitotic activity with no glandular/tubular differentiation. Fourth to ninth columns and ERα column: IHC staining for progesterone receptor (PgR), HER2, and Ki67 and western blot analysis of ERα showing the concordance of the hormone receptor status and proliferation status of the PDX/PDxO pairs with the originating patient tumors (details in Supplementary Fig. S8A). Scale bars: 50μm. C, Hierarchical clustering correlation heatmap illustrating transcriptome fidelity between PDX tumors (T) and their derived organoids (O). The color scale within the heatmap indicates the Pearson correlation coefficient. Hierarchical clustering on the top and left side depicts the distance between models. D, G2/M gene signature expression in PR PDX tumors (T) and their derived PDxOs (O). Color scale indicates the extent of gene expression levels (on log2 scale). E, Dose-response curves for PDxO models depicting the effect of treatment with 0.001–10 μM concentrations of abemaciclib or palbociclib for 6 days, followed by 6 days of recovery in drug-free medium. Organoid viability was assessed by Cell Titer-Blue assay. Data were normalized to DMSO (100%), plotted, and analyzed by nonlinear regression using GraphPad Prism 9 software. The dashed lines indicate IC50 values. The difference between the IC50 values for palbociclib and abemaciclib treatment, or ΔIC50, was calculated as IC50 palbociclib – IC50 abemaciclib. Each experiment included three biological replicates per concentration. Data represent the mean ± SEM; n ≥ 3 independent experiments. F, Bar graph summarizing differences in IC50 values for each PDxO model. G, Pearson correlation between the PDxO drug response assessed by Cell Titer-Blue viability assay and by measuring the organoid area.
