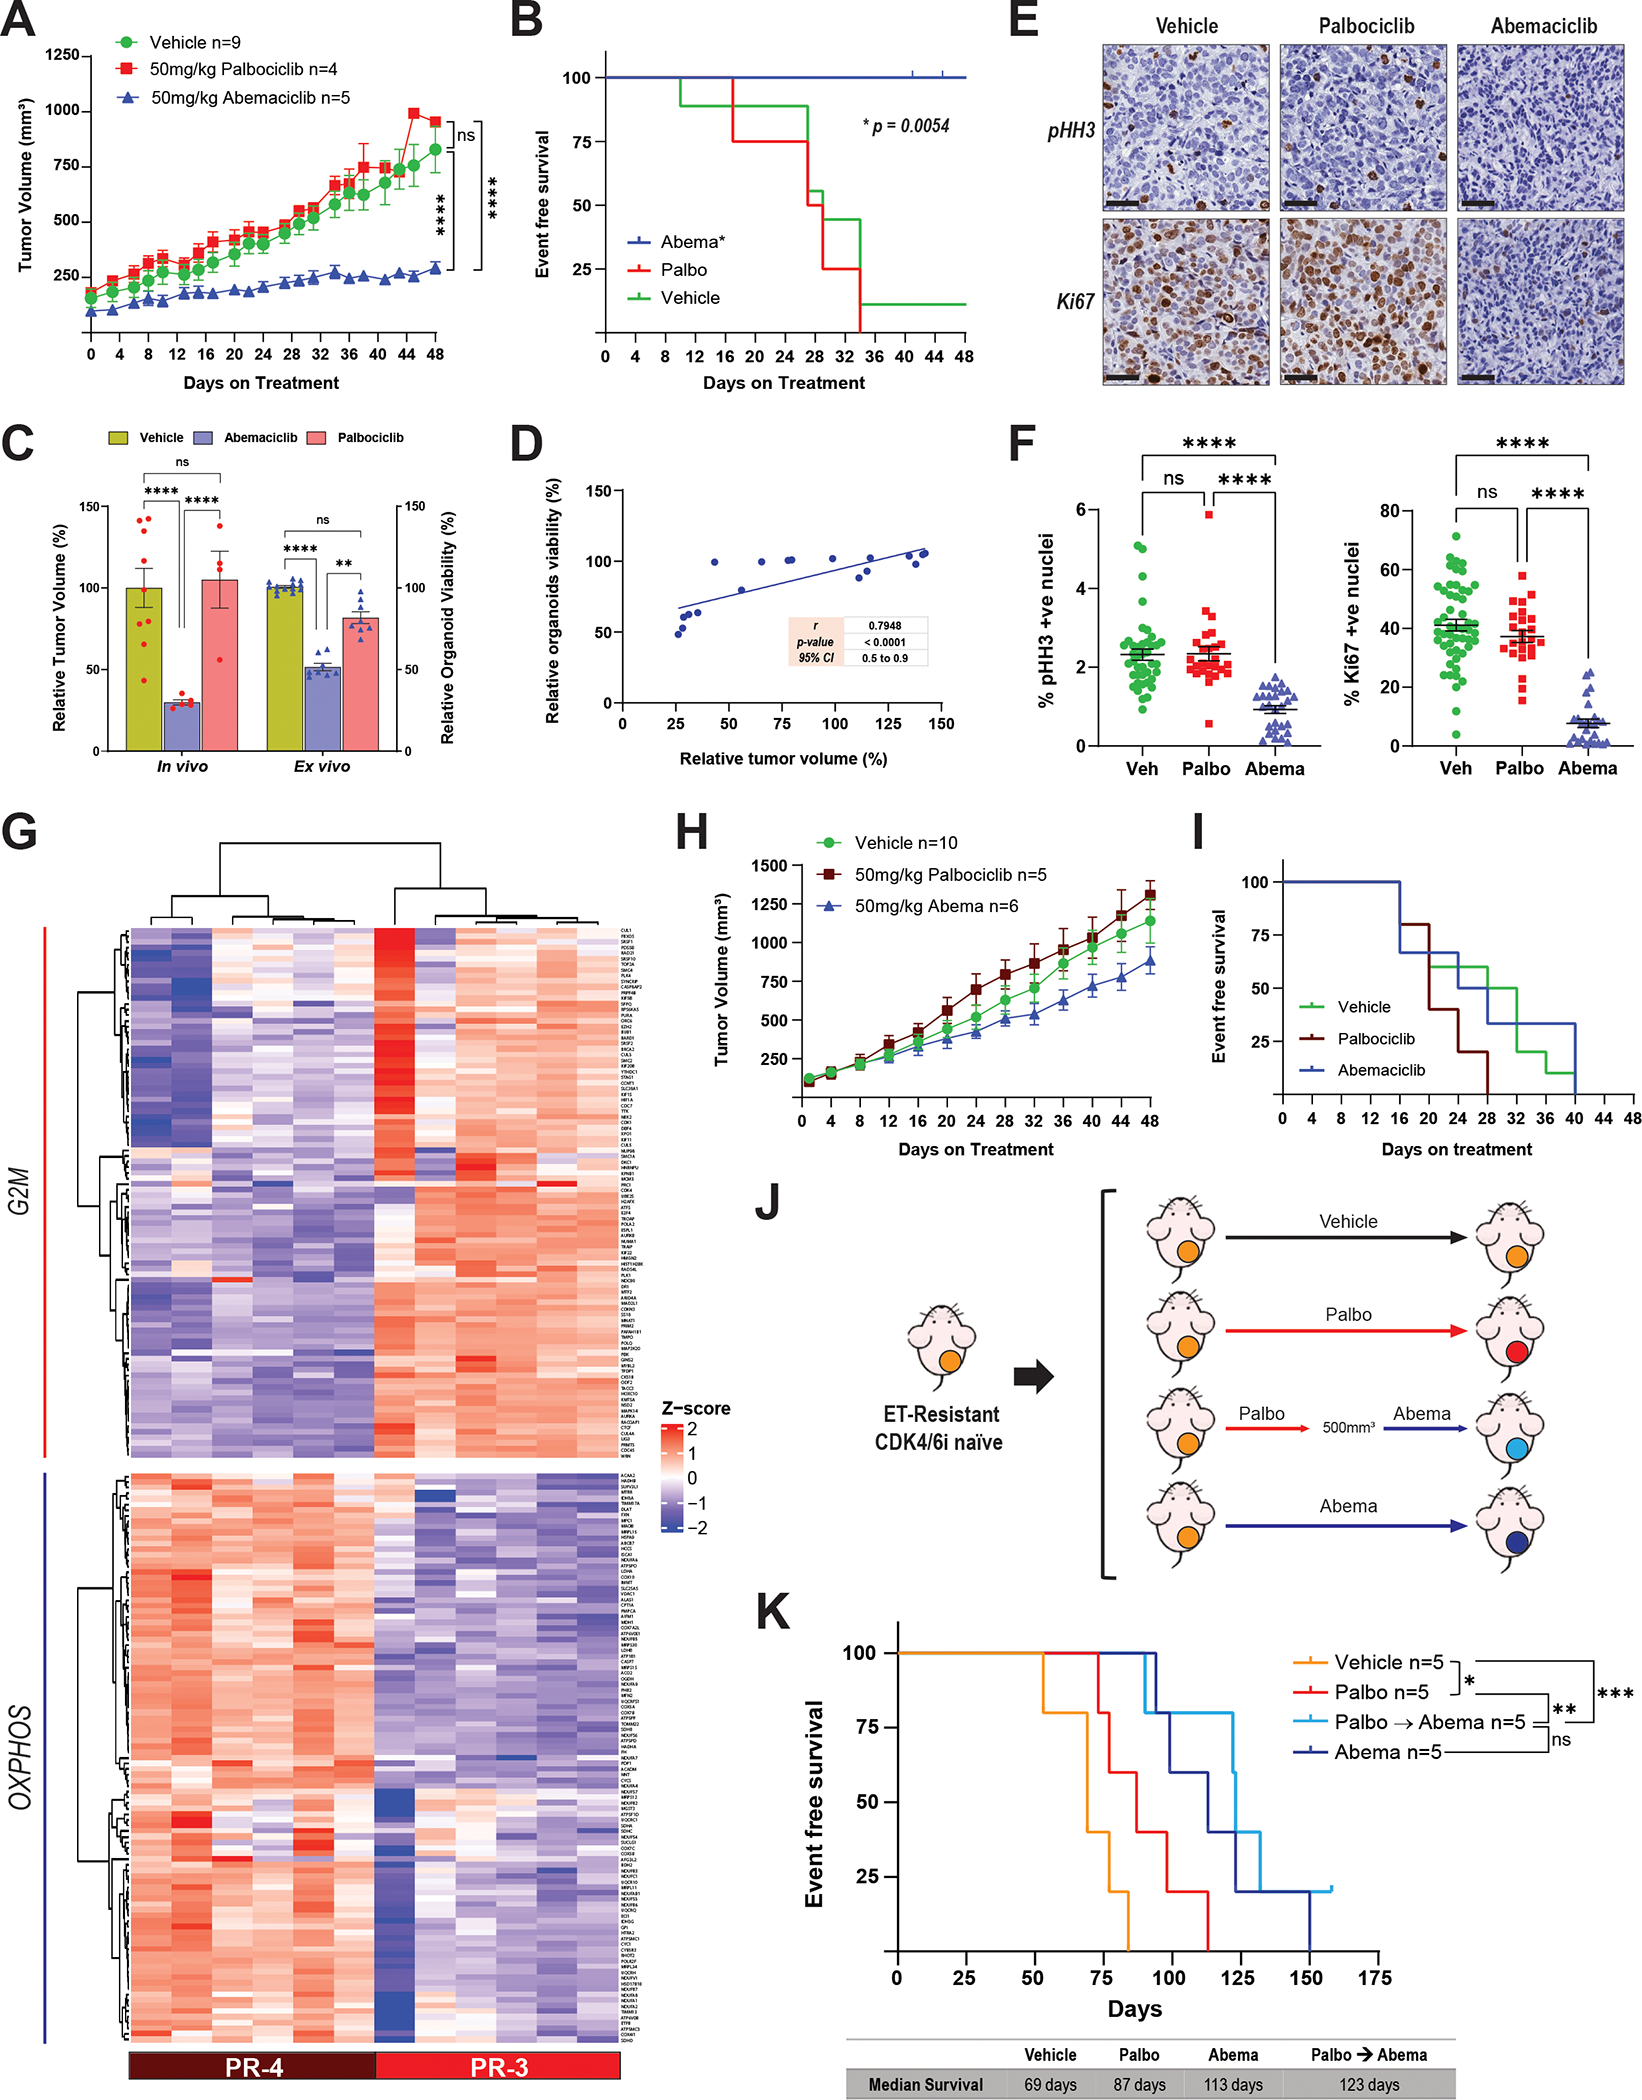
Figure 5. Abemaciclib inhibits tumor growth and prolongs survival after progression on palbociclib therapy.

A, Tumor growth curves of female nude mice bearing the PR-3 PDX model and treated with abemaciclib (50 mg/kg PO, every day), palbociclib (50 mg/kg PO, 21-day cycle), or vehicle for 48 days. Before treatment, tumors were allowed to grow until they reached a volume of 100–200 mm3 in the presence of E2 (8 μg/mL) supplementation in the drinking water. Once treatment started, the E2 supplementation was removed to mimic the effect of ET. The length and width of tumor xenografts were measured by calipers 2–3 times per week, and the tumor volume was calculated as (length × (width)2)/2. All tumors were collected at the same time and processed for biomarker analysis. The differences between groups were evaluated by two-way ANOVA, Tukey’s multiple comparisons test. **** P ≤ 0.0001; ns: not significant. Data represent the tumor volume mean ± SEM; n = 9 mice for vehicle, n = 4 mice for palbociclib, n = 5 mice for abemaciclib. B, Survival analysis of female nude mice bearing the PR-3 PDX model and treated as described in A. Event-free survival was calculated based on the time on treatment when tumor volume reached 500 mm3. The difference between survival curves was calculated using the log-rank (Mantel-Cox) test. C, Comparison of the response to abemaciclib and palbociclib treatment in the PR-3 PDX model (in vivo) and its matched organoids (ex vivo). Relative tumor volume (%) was calculated from the experiment shown in A, and relative organoid viability (%) was calculated from the experiments shown in Fig. 4E. The difference between groups was evaluated by two-way ANOVA, Tukey’s multiple comparisons test. ** P ≤ 0.0085; **** P ≤ 0.0001; ns: not significant. D, Pearson correlation between the tumor volume and the organoid viability from experiments in A and Fig. 4E, respectively. E and F, pHH3 and Ki67 immunohistochemistry analysis of PR-3 PDX tumor tissues from the experiment shown in A. Representative images (40× magnification, Scale bars: 50μm) are shown in E. Quantification of Ki67- and pHH3-positive nuclei was performed using QuPath software (and independently by a pathologist) by assessing multiple areas in each individual tumor for each treatment to cover the entire tumor, and data are presented as mean ± SEM. The difference between groups was evaluated by two-way ANOVA, Tukey’s multiple comparisons test. **** P ≤ 0.0001; ns: not significant. G, Hierarchical clustering heatmap depicting the leading-edge gene expression of G2/M and OXPHOS pathways in PR-3 (n = 6 mice) compared to PR-4 (n = 6 mice) models. H, Tumor growth curves of female nude mice bearing the PR-4 PDX model and treated as described in A. The difference between groups was evaluated by two-way ANOVA, Tukey’s multiple comparisons test; no significant differences were observed. Data represent the tumor volume mean ± SEM; n = 10 mice for vehicle, n = 5 mice for palbociclib, n = 6 mice for abemaciclib. I, Survival analysis of female nude mice bearing the PR-4 PDX model and treated as described in A. Event-free survival was calculated based on the time on treatment when tumor volume reached 500 mm3. The difference between survival curves was calculated using the log-rank (Mantel-Cox) test. No significant differences were observed. J, Preclinical experimental design to assess the response to abemaciclib following lack of response to palbociclib in an endocrine therapy–resistant (ET-R) and CDK4/6i-naive PDX model. Female nude mice bearing the ET-R PDX model were randomized into four arms as indicated and treated with vehicle; palbociclib (75 mg/kg PO, 21-day cycle); palbociclib as the first CDK4/6i followed by sequential treatment with abemaciclib once the tumors reached 500 mm3; or abemaciclib (50 mg/kg PO, every day). E2 supplementation was given as described in A. K, Survival analysis of mice treated as described in J. Event-free survival was calculated based on the duration of treatment prior to the tumor burden reaching the ethical endpoint. The difference between survival curves was calculated using the log-rank (Mantel-Cox) test. * P ≤ 0.05; ** P ≤ 0.01; *** P ≤ 0.001; ns: not significant.
