
Figure 6. Clinical outcomes in patients with HR+/HER2-negative metastatic breast cancer treated with abemaciclib after progression on prior CDK4/6i treatment.
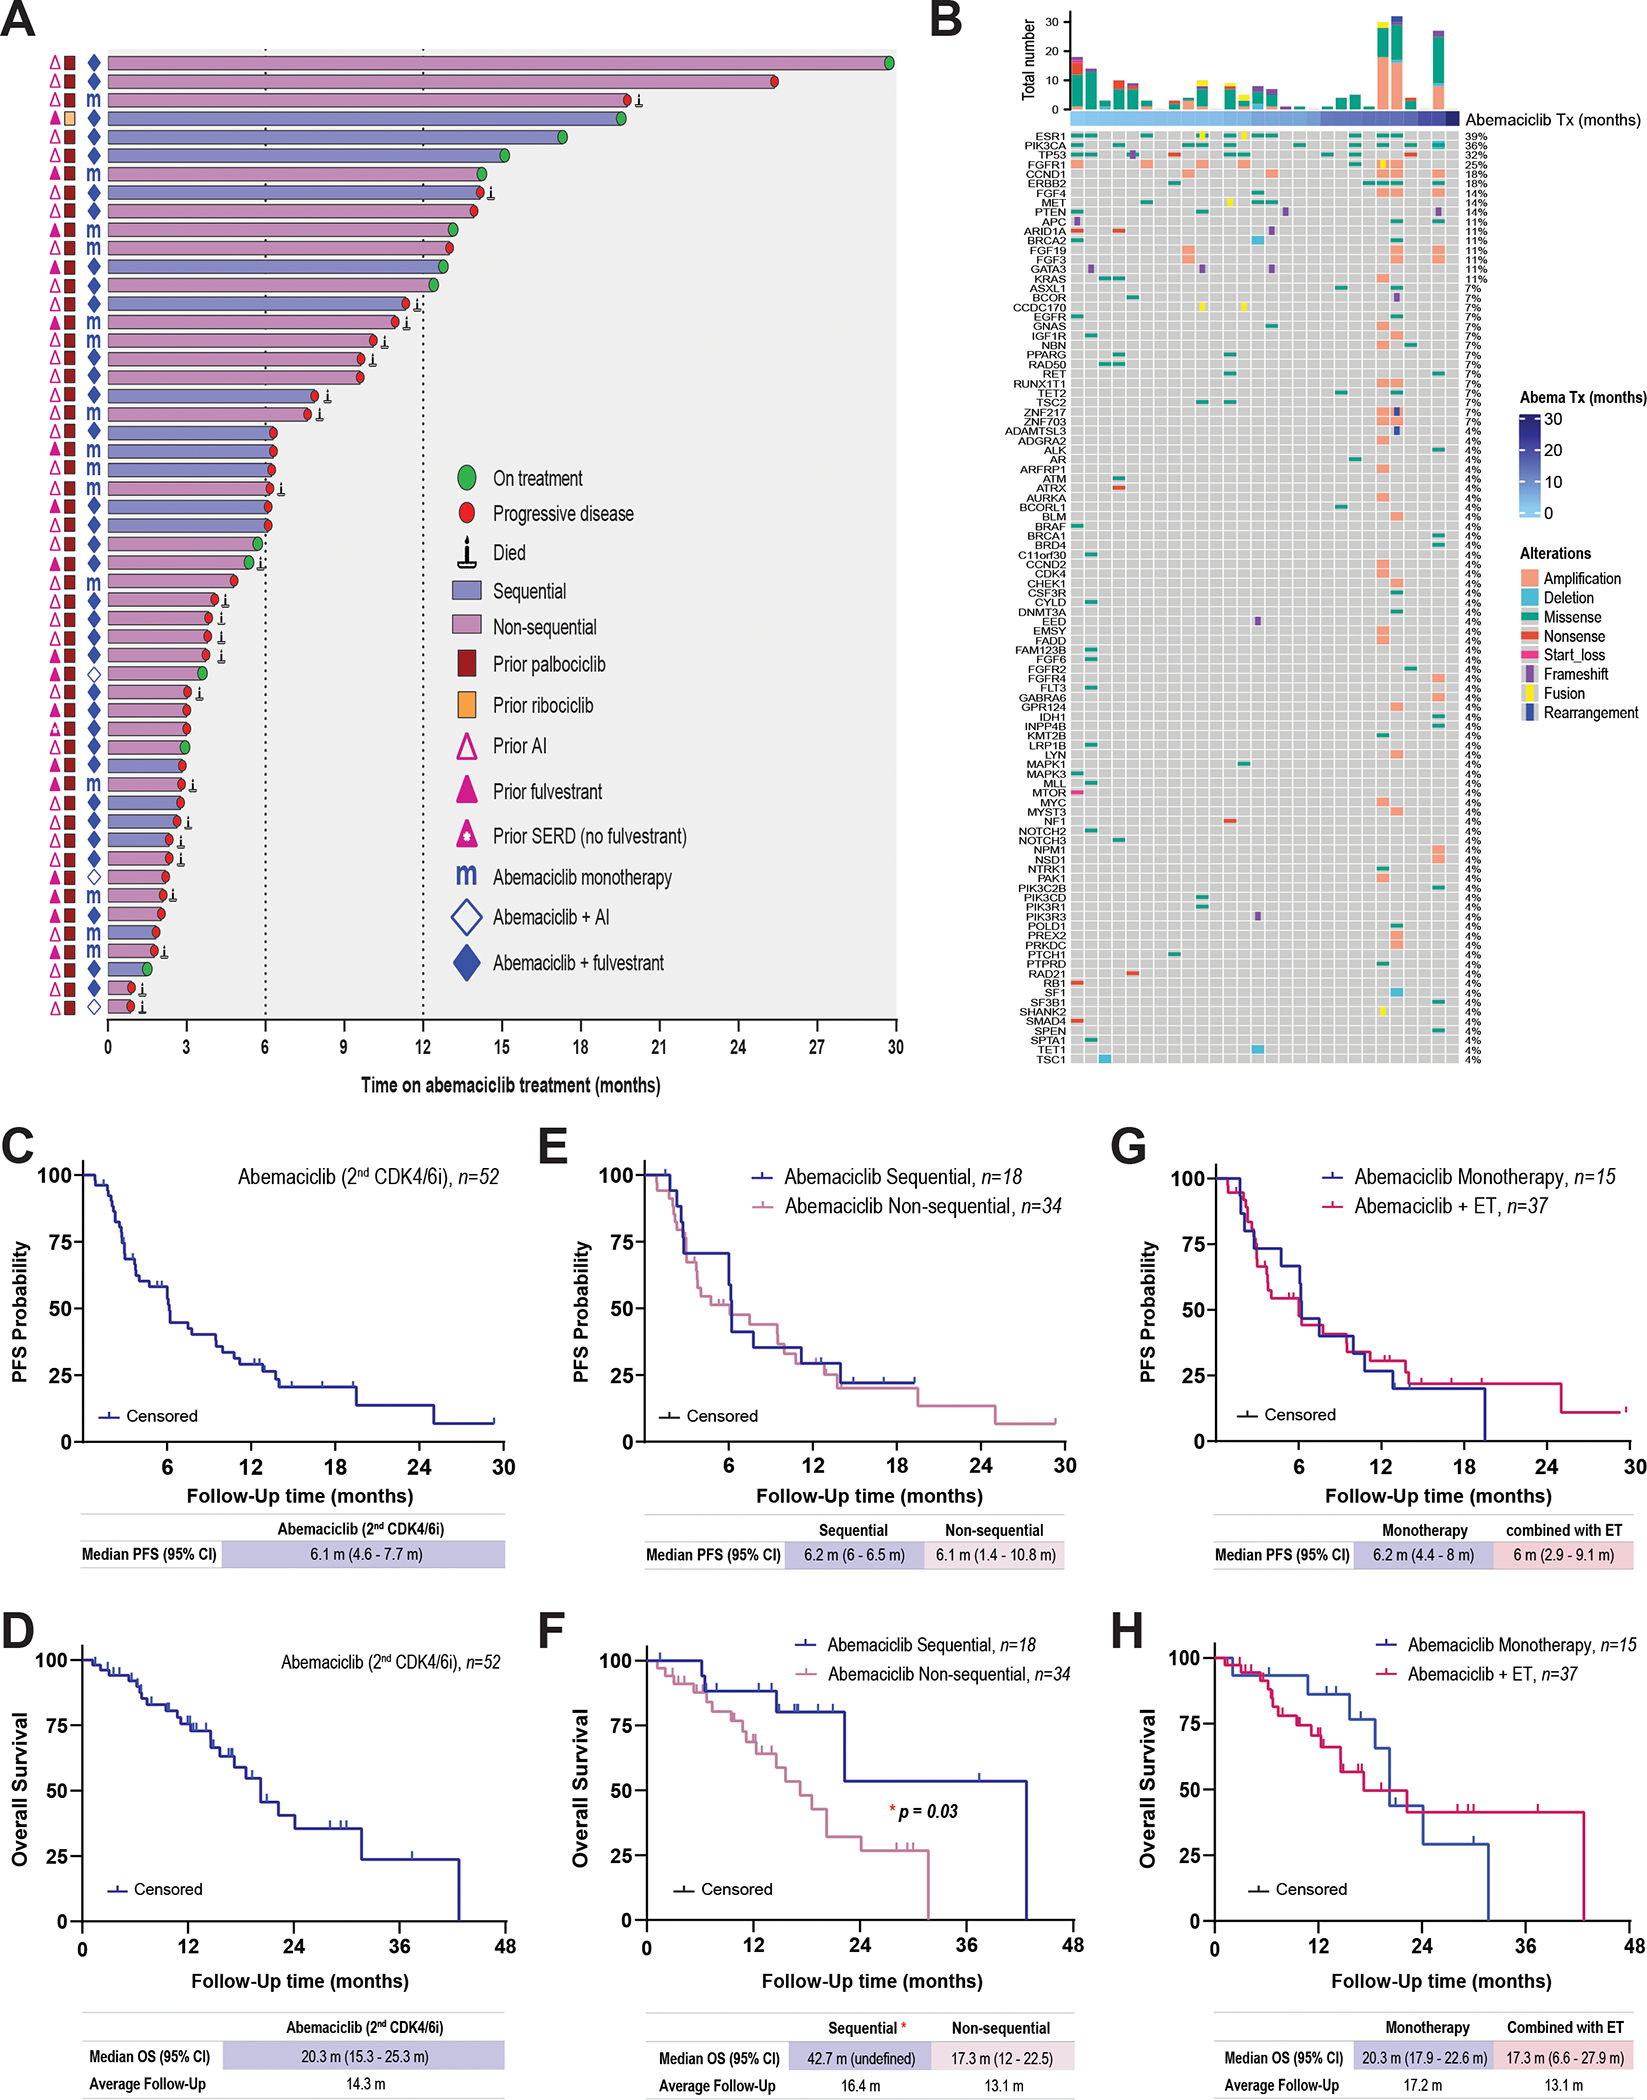
A, Swimmer plot depicting the prior CDK4/6i treatment course, duration of abemaciclib-based therapy, and subsequent clinical outcome. From left to right: pink triangles represent prior ET. Red and yellow squares represent the initial CDK4/6i agent received. Blue “m” and diamonds represent the abemaciclib treatment regimen received after progression on the first CDK4/6i: blue “m”, monotherapy; blue diamonds, combinations with ET. The bars indicate the abemaciclib treatment sequence after the prior CDK4/6i: blue, sequential; purple, non-sequential. The symbols at the ends of the bars represent the clinical outcome on abemaciclib treatment: green circle, still receiving abemaciclib treatment at data cutoff in December 2022; red circle, disease progressed; candle, patient died. B. Distribution of alterations on the gene panel of the patient baseline biopsies (n = 28). Oncoprint plot shows all the genes of interest sorted by mutation frequency form high to low (see supplemental Materials and Methods). The percentage of samples with any gene alteration is indicated on the right side. Each column represents a patient sample. Samples are ordered by abemaciclib treatment time in months. Total number of alterations for each sample is indicated in the bar plot on the top. Colors and shapes refer to different variant types. C and D, Kaplan–Meier analysis of PFS (C) and OS (D) in patients receiving abemaciclib therapy after prior disease progression on palbociclib or ribociclib. E and F, PFS (E) and OS (F) in patients stratified based on whether they received abemaciclib treatment sequentially or non-sequentially after the prior CDK4/6i. G and H, PFS (G) and OS (H) in patients stratified based on whether they received abemaciclib as monotherapy or combined with ET. Survival curves were compared using the log-rank (Mantel-Cox) test.