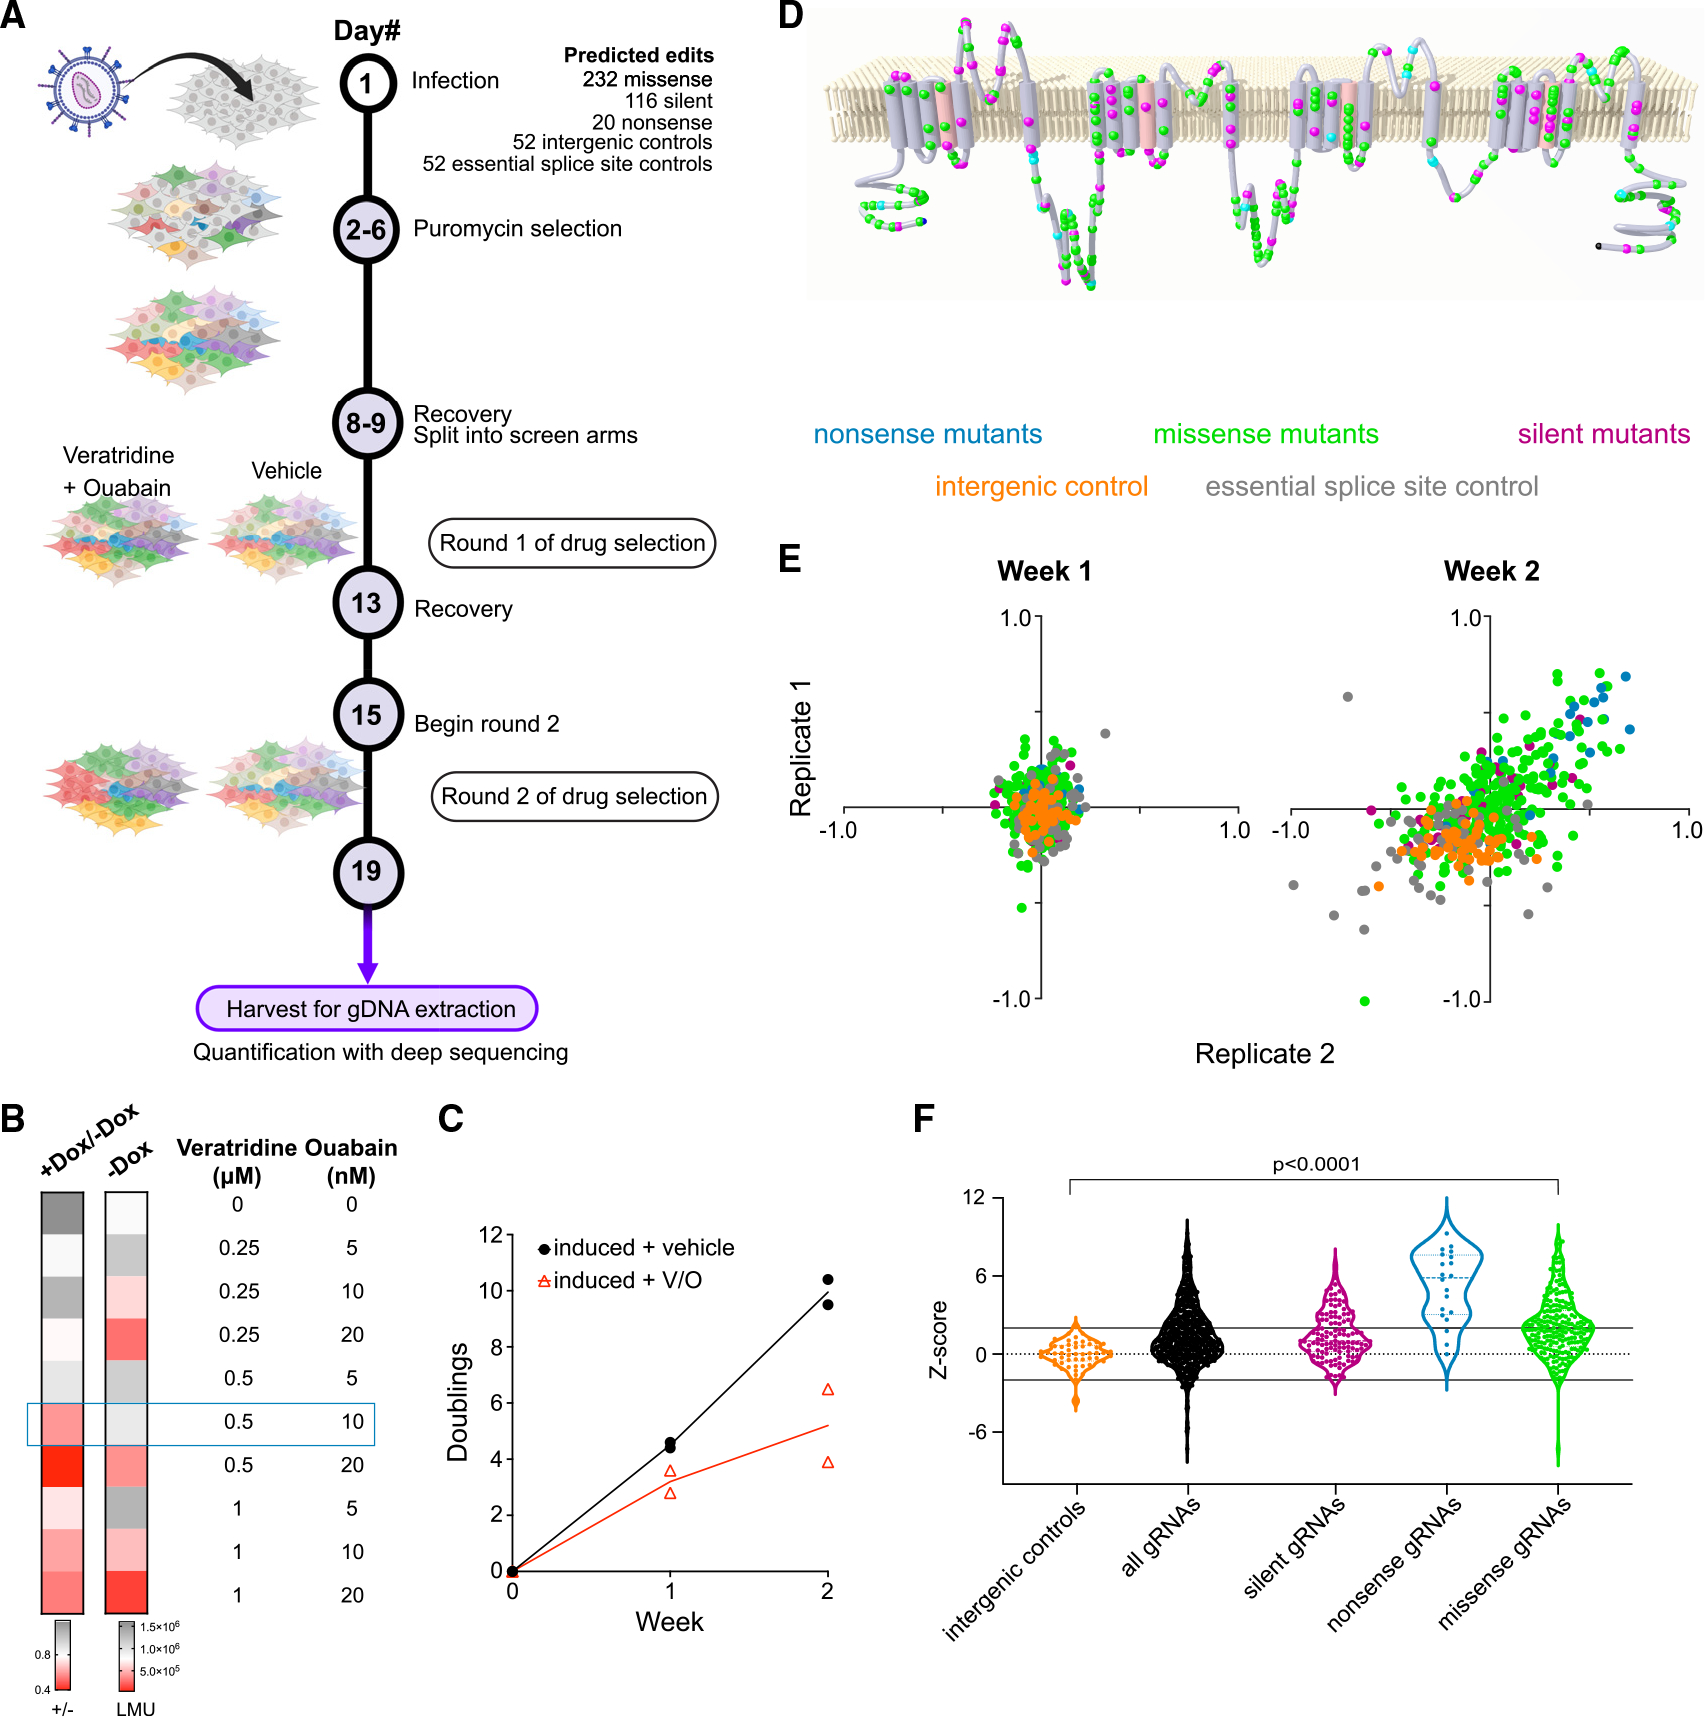
Figure 1. A pooled viability screen prioritizes putative gain- and loss-of-function mutations in NaV1.2.

(A) Schematic of base-editing screen targeting NaV1.2. Two rounds of veratridine and ouabain treatment were applied to amplify enrichment/depletion. Figure created using BioRender.com.
(B) Heatmap showing optimization of assay conditions for a pooled viability screen in NaV1.2 cells. The cellular viability in a variety of veratridine and ouabain concentrations is assessed by luminescence using a Cell-Titer Glo assay. The first column represents the ratio of luminescence from doxycycline-induced cells to luminescence from uninduced cells as a measure of NaV1.2-dependent toxicity. The second column represents the luminescence readout (LMU) from uninduced cells and is a measure of drug toxicity independent of NaV1.2 (n = 3 wells; representative of three independent experiments).
(C) The number of doublings for two independent replicates monitored over 2 weeks in the presence and absence of the veratridine-ouabain treatment (n = 2 independent infections).
(D) A membrane topology map of the NaV1.2 protein shows the distribution of targeted nonsense (cyan), missense (green), and silent (magenta) mutations included in the gDNA library.
(E) Scatterplots of the log fold change of each individual gRNA (colored dot) in the veratridine-ouabain arm compared with the vehicle control arm. Two independent replicates of the screen are plotted against each other for each week of the screen. The color code for different types of gRNAs is indicated above the plots.
(F) Violin plots of Z scores constructed for each gRNA in the screen using intergenic targeting gRNAs as negative controls (n = 2 independent infections).
