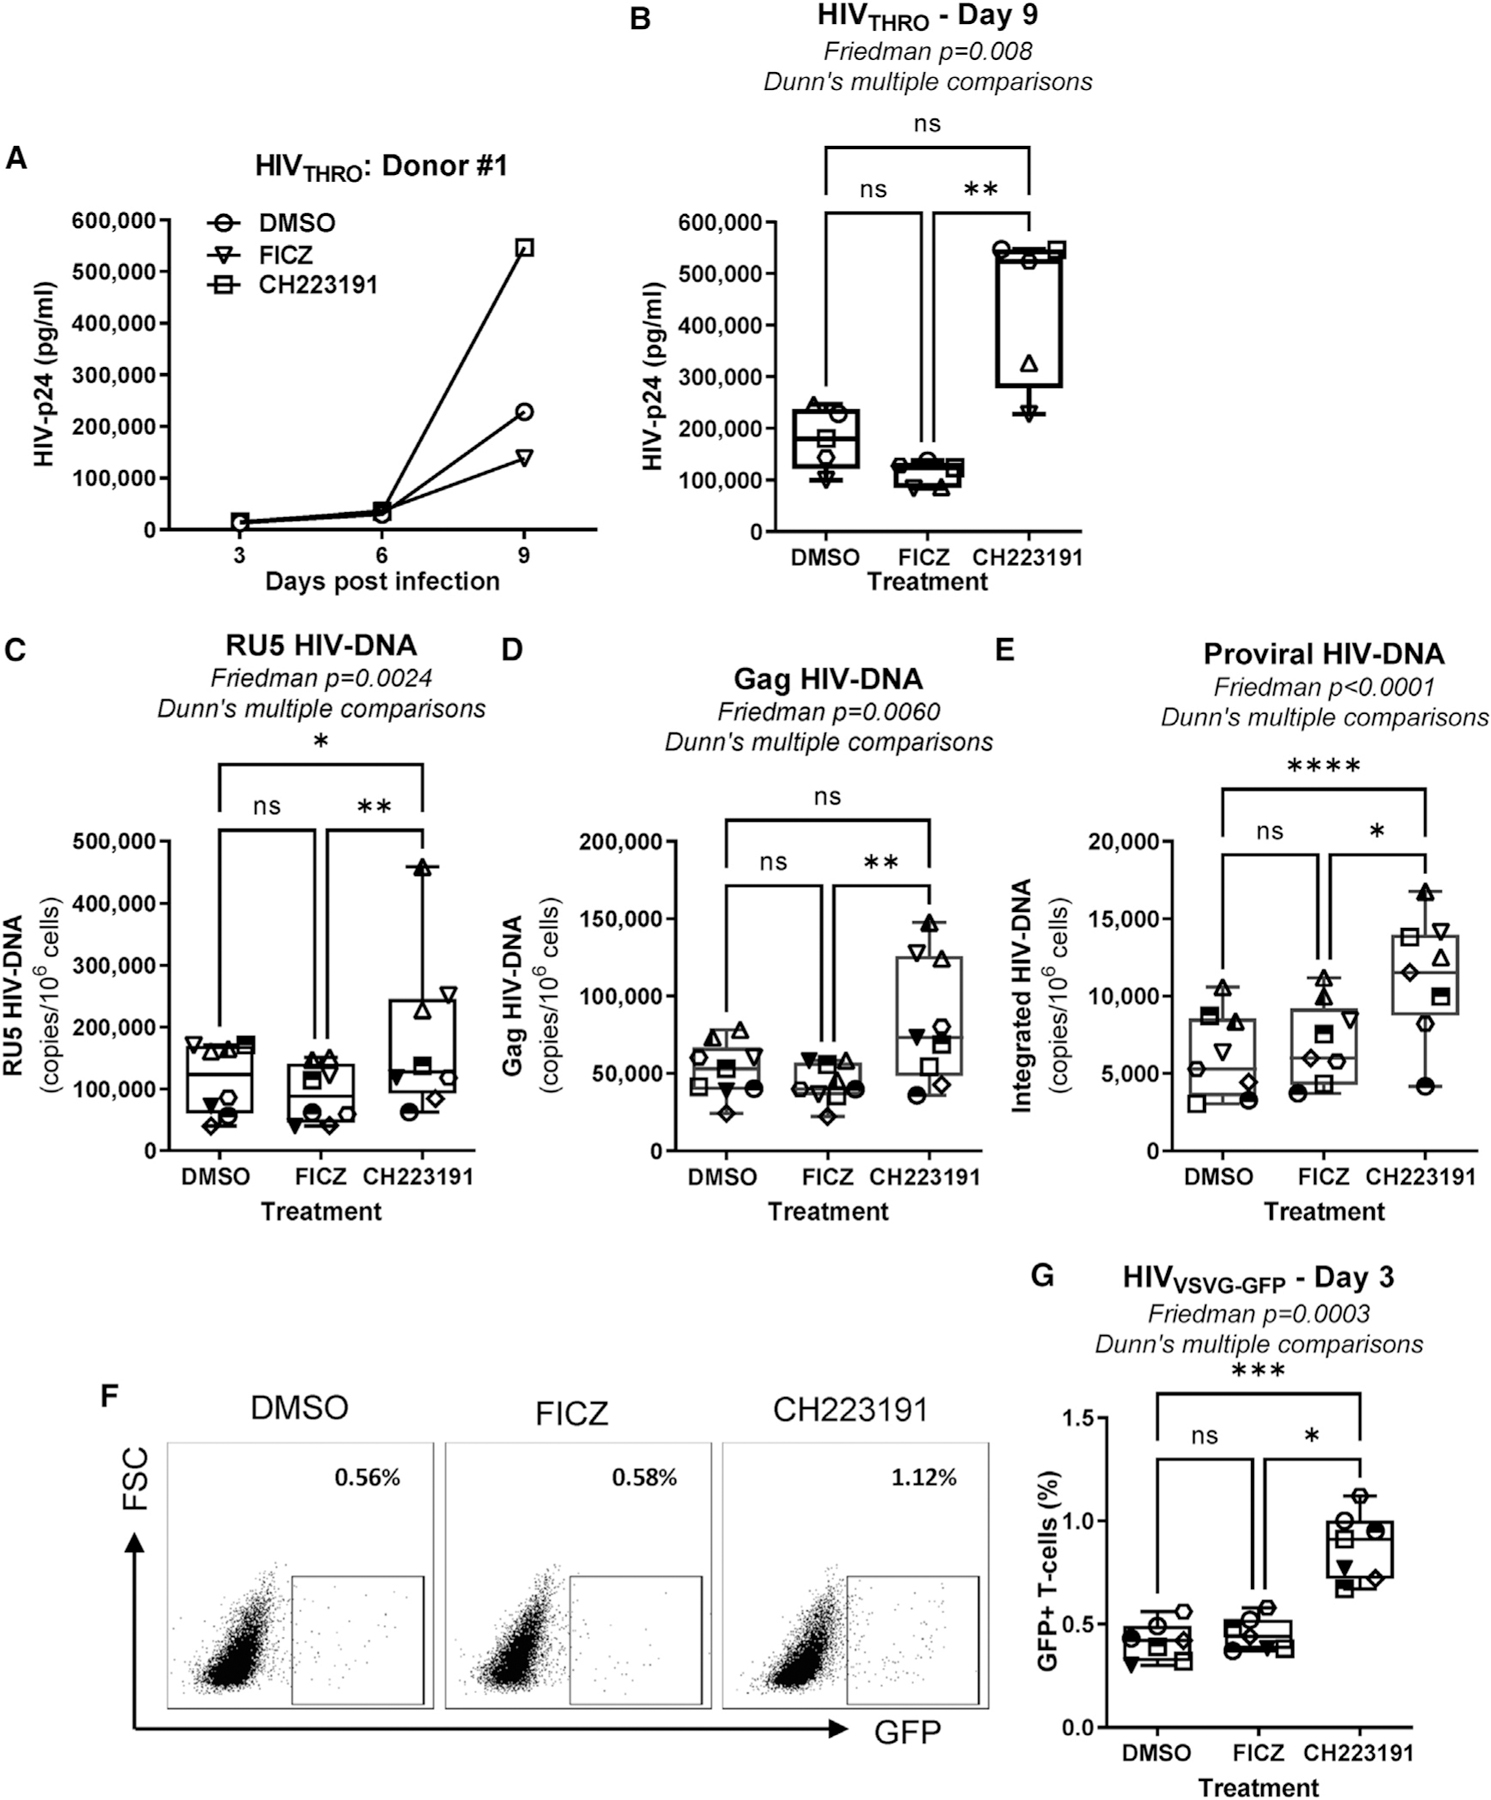
Figure 3. The AhR antagonism increases HIV-1 replication in CD4+ T cells at post-entry levels, between reverse transcription and integration.

Memory CD4+ T cells isolated from PBMCs of HIV-uninfected individuals were activated via CD3/CD28 and cultured in the presence/absence of the AhR antagonist CH223191 (10 μM) or agonist FICZ (100 nM) for 3 days. Cells were exposed to transmitted founder (T/F) HIVTHRO (50 ng HIV-p24/106 cells) and cultured for up to 9 days with rhIL-2 in the presence/absence of CH223191 or FICZ.
(A and B) Shown are HIV-p24 levels quantified by ELISA in cell-culture supernatants collected at days 3, 6, and 9 post-infection in one representative donor (A) and statistical analysis of results obtained using cells from n = 5 donors at day 9 post-infection (B). In parallel, cells were exposed to single-round VSV-G-pseudotyped HIV-1 encoding gfp in place of nef (HIVVSVG-GFP) (50 ng HIV-p24/106 cells) and cultured for 3 days in the presence/absence of CH223191 or FICZ.
(C–E) Levels of early (RU5) (C) and late (Gag) reverse transcripts (D), as well as integrated HIV-DNA levels (E), were quantified by real-time nested PCR at day 3 post-infection.
(F and G) The GFP expression was measured by flow cytometry as an indicator of HIV-1 transcription/translation. Shown is the frequency of GFP+ T cells in one representative donor (F) and statistical analysis of GFP expression in T cells from n = 7 donors (G). Each symbol represents one donor.
(B–E and G) The Friedman test p values and Dunn’s multiple comparison significance are indicated on the graphs (*p < 0.05; **p < 0.01; ***p < 0.001). Shown are boxes and whisker plots, with minimum to maximum values.
