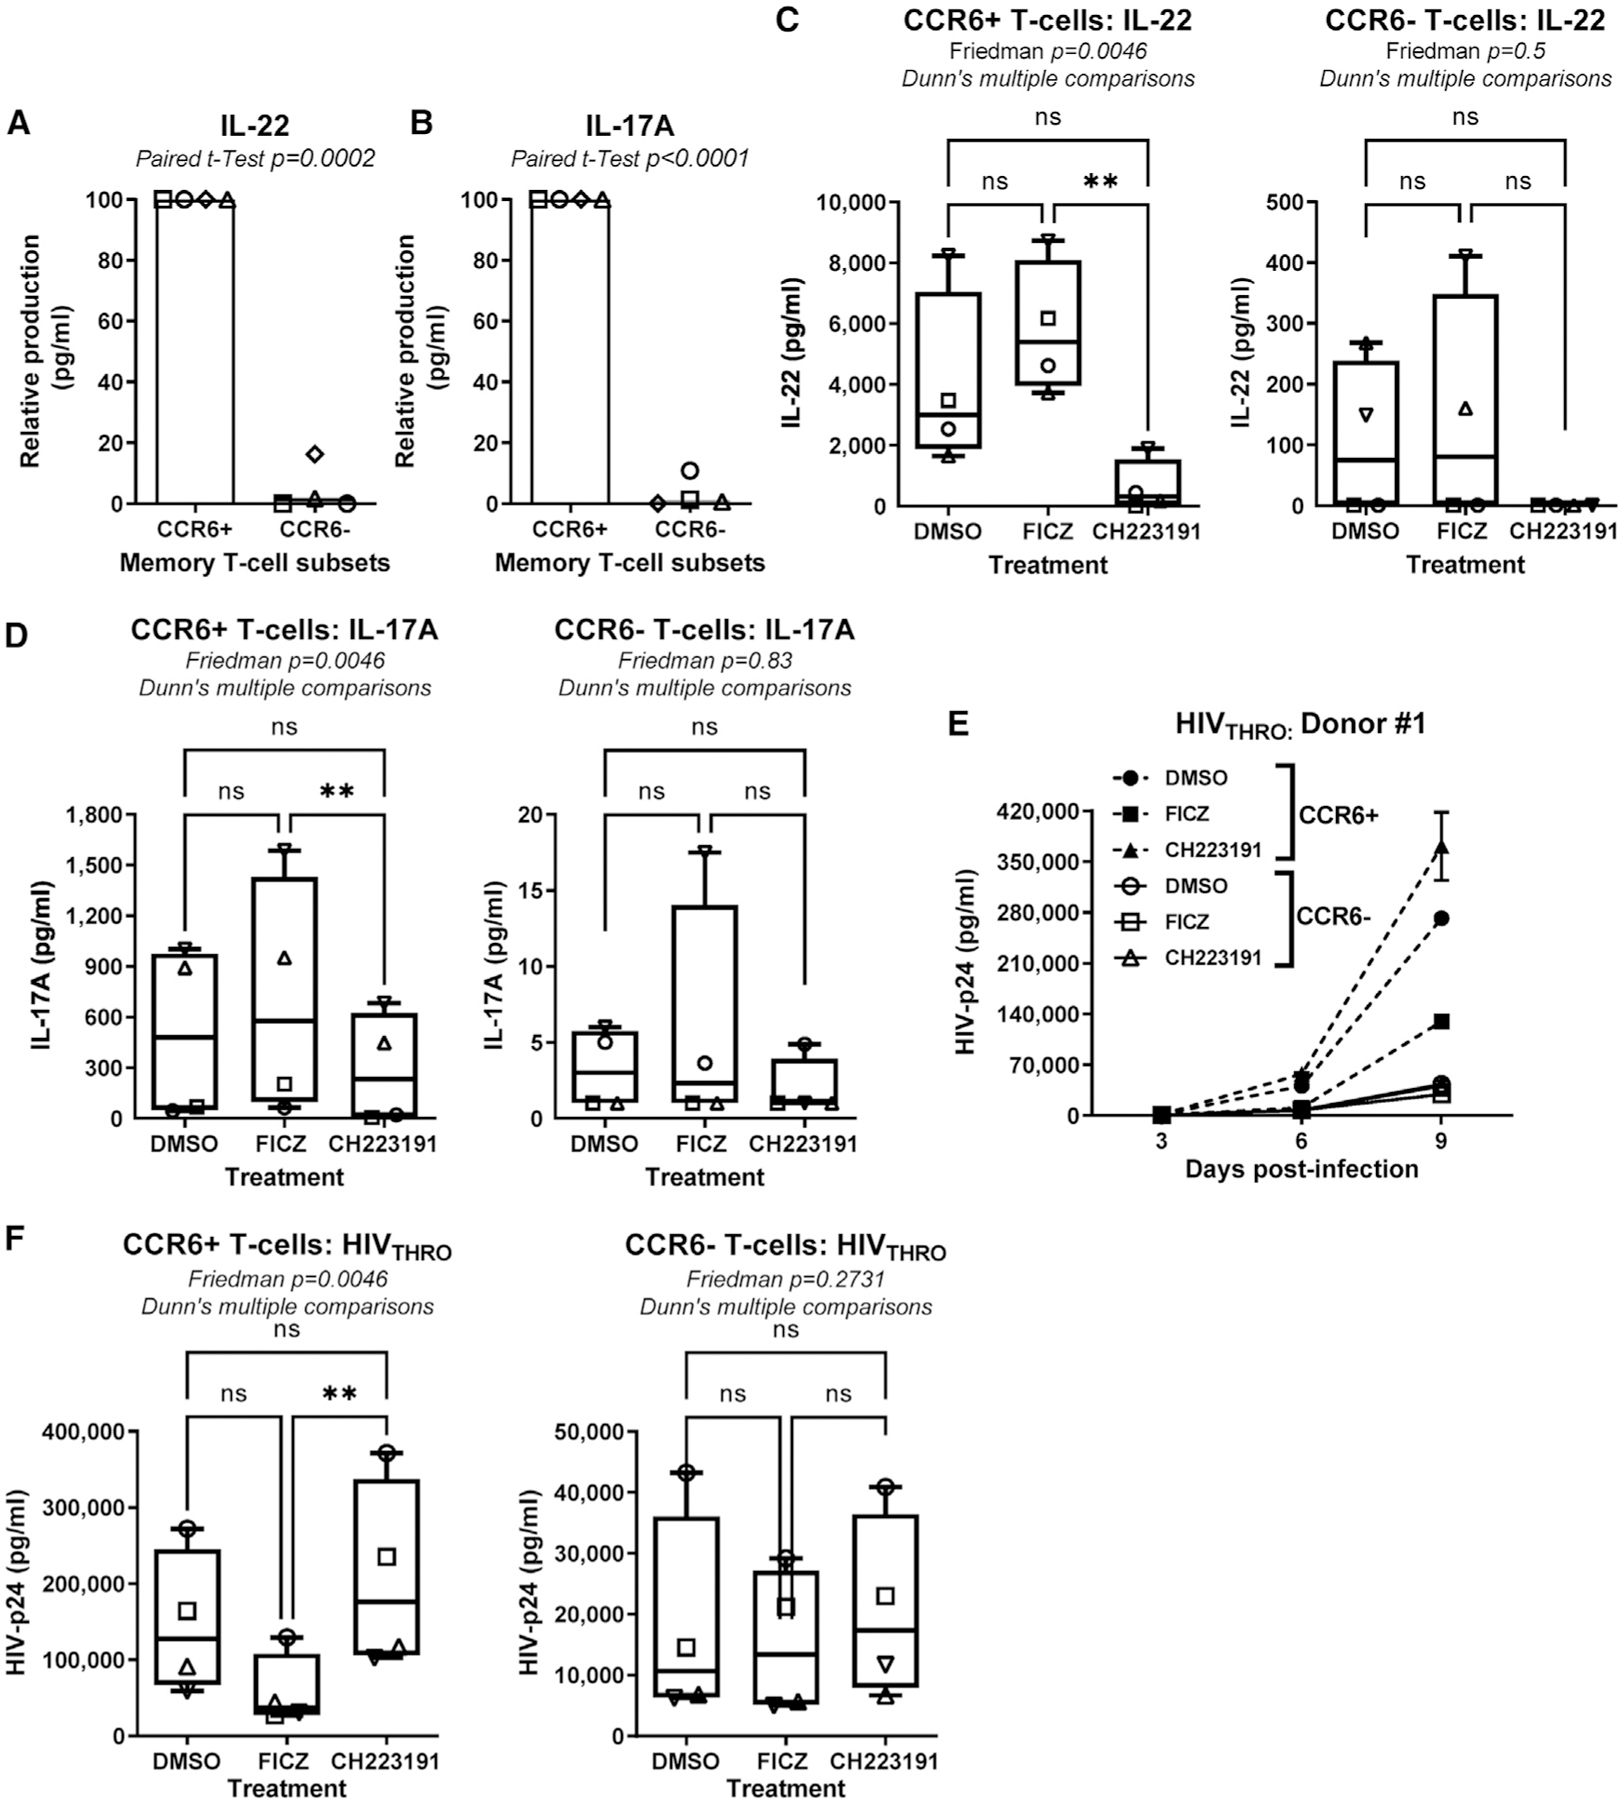
Figure 4. The AhR blockade increases HIV-1 replication in CCR6+CD4+ T cells.

Flow cytometry-sorted memory CCR6+ and CCR6−CD4+ T cells isolated from PBMCs of HIV-uninfected individuals were stimulated via CD3/CD28 Abs in the presence/absence of the FICZ (100 nM) or CH223191 (10 μM) for 3 days. Cells were exposed to T/F HIVTHRO (50 ng HIV-p24/106 cells) and cultured with rhIL-2 in the presence/absence of AhR drugs.
(A–D) Levels of IL-22 (A and C) and IL-17A (B and D) were measured by ELISA in cell-culture supernatants of CCR6+ versus CCR6− T cells (A and B; relative cytokine production) treated or not with FICZ or CH223191 (C and D; absolute cytokine levels) at day 3 post-TCR triggering (n = 4).
(E and F) Shown are HIV-p24 levels quantified by ELISA in cell-culture supernatant collected at day 3, 6, and 9 post-infection in one representative donor (E) and statistical analysis of results obtained using cells from n = 4 different HIV-uninfected donors (F, CCR6+ T cells, left panel; CCR6− T cells, right panel). Each symbol represents one donor.
Paired t test p values (A and B) and Friedman test p values and Dunn’s multiple comparison significance (C, D, and F) are indicated on the graphs (*p < 0.05; **p < 0.01; ***p < 0.001). Shown are bars that indicate mean values (A–B) and boxes and whisker plots, with minimum to maximum values (C–D ) and (F).
