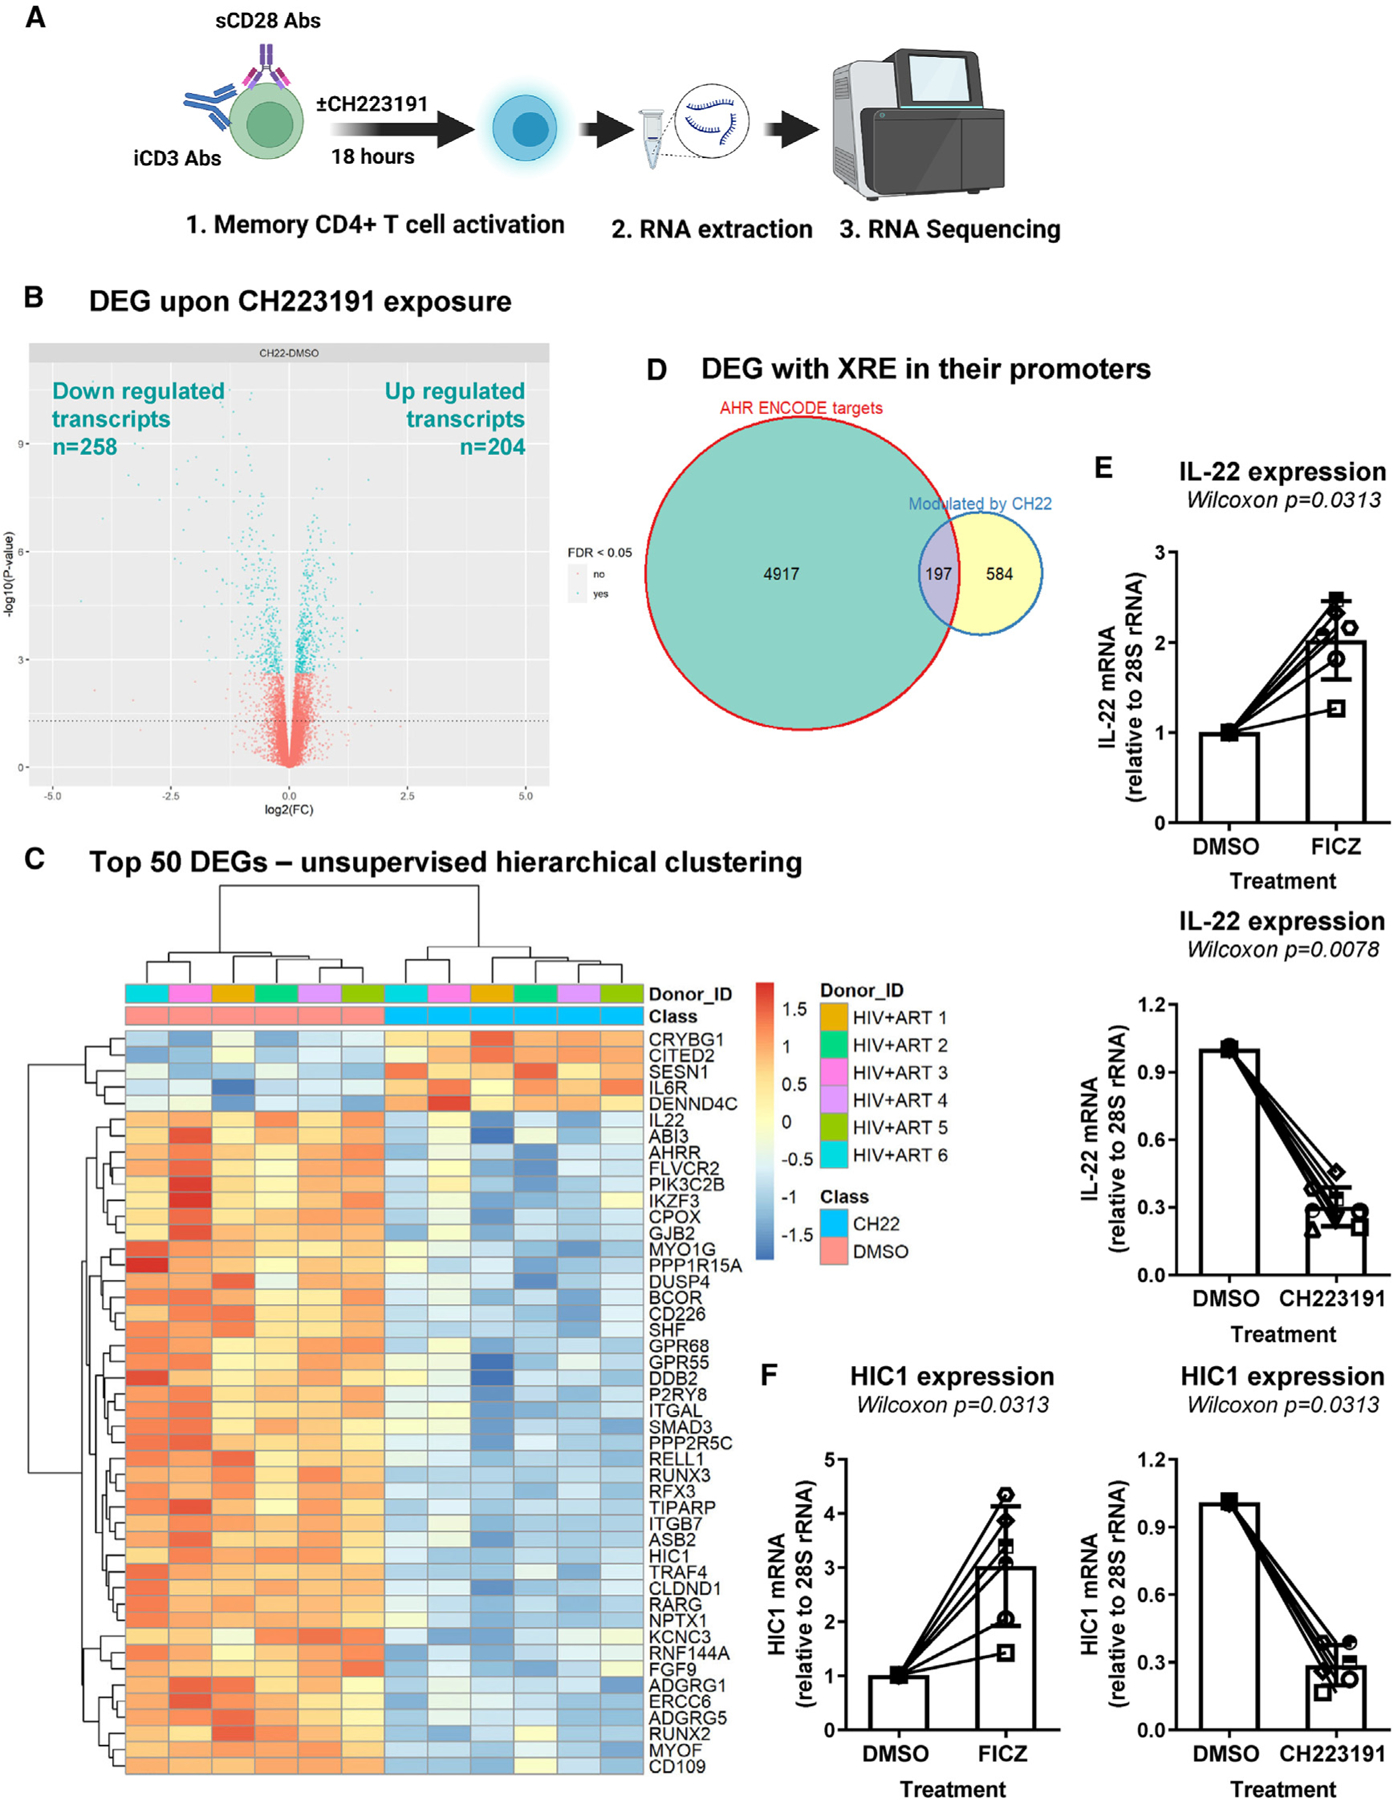
Figure 6. Transcriptional reprogramming of CD4+ T cells upon pharmacological AhR inhibition.

(A) Shown is the flow chart of RNA sequencing. Briefly, memory CD4+ T cells of ART-treated PLWH (n = 6) were isolated and stimulated with CD3/CD28 Abs and cultured in the presence/absence of CH223191 (10 μM) for 18 h. Total RNA was extracted and used for RNA sequencing (Illumina Technology).
(B) Volcano plots for all probes in each linear model presented with the log2 FC on the x axis and the negative logarithm of the adjusted p values for false discovery rate (FDR) on the y axis. The red/blue color code is used based on the 5% FDR threshold.
(C–F) Shown are the representation of AhR direct target genes modulated by CH223191, as identified using the ENCODE Bioinformatic tool (https://www.encodeproject.org) (C); top differentially expressed genes (DEGs; identified based on p values) in CD4+ T cells exposed or not to CH223191 (D); IL-22 mRNA levels quantified by qPCR in CD4+ T cells exposed or not to FICZ or CH223191 (n = 6) (E); and HIC1 mRNA levels in CD4+ T cells exposed or not to FICZ or CH223191 (F).
(E and F) Each symbol represents an individual donor; bars indicate median values. Wilcoxon matched-pairs signed rank test p values are indicated on the graphs. Shown are bars that indicate mean ± SD values.
