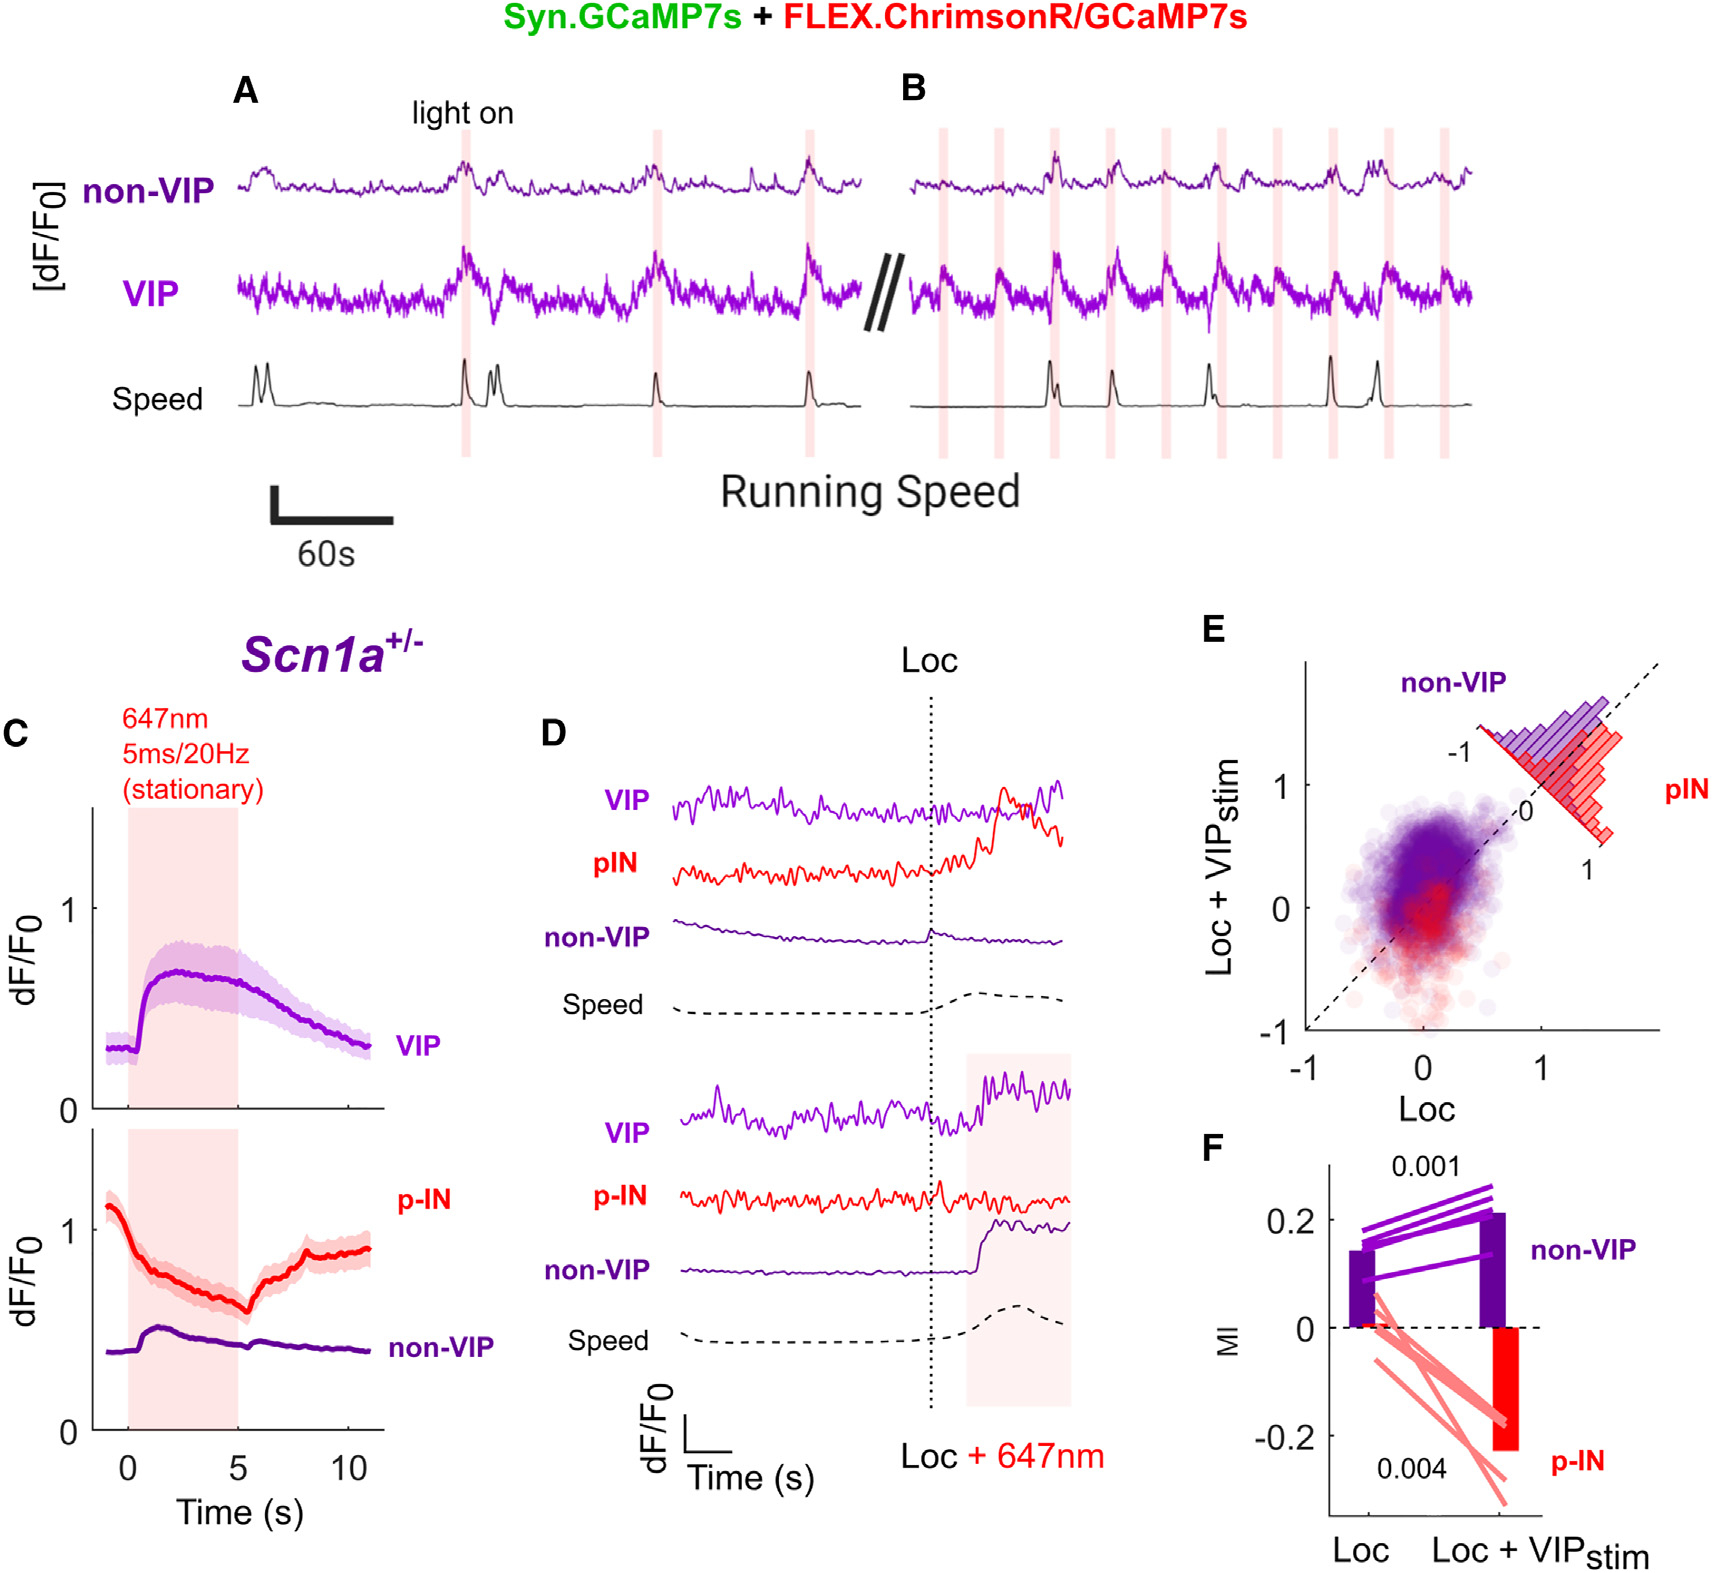
Figure 3. Optogenetic activation of VIP-INs normalizes neocortical dynamics associated with the transition to locomotion in Scn1a+/− mice.

(A and B) Example trial of simultaneous imaging:optogenetics in Scn1a+/− mice in vivo. VIP-INs expressing ChrimsonR were stimulated for 5 s with 20-Hz/5-ms red-light pulses either (A) triggered by onset of locomotion with a 60-s time-out period between stimulations or (B) every 30 s. This ensured that stimulation occurred during both locomotion and quiet resting periods for each mouse. Neural data are an average of all cells (VIP or non-VIP) within a single FOV − [dF/F0]. Scale bars: y axis, 0.5 dF/F0 or 100 mm/s; x axis, 60 s.
(C) Average VIP-IN and non-VIP dF/F0 elicited by 5-s laser stimulation during stationary epochs. VIP-INs are uniformly activated, while non-VIP neurons show a heterogeneous response (Figure S7) with an average disinhibitory response across most cells and strong inhibition of approximately ~10% of non-VIP cells, which are likely the population of INs directly targeted by VIP-INs (p-INs) based on low-skew traces of dF/F0. Lines and shaded area represent mean ± 95% CI. (D) Example dF/F0 traces from a single VIP-IN, p-IN, and putative pyramidal (non-VIP) neuron aligned to an individual locomotion bout with and without laser stimulation. Horizontal dotted lines represent running speed (Speed), the vertical dotted line is detected locomotion onset (Loc), and the solid line and shaded area represent laser stimulation (+647). Scale bars: y axis, 1 dF/F0 or 100 mm/s; x axis, 2 s.
(E) Locomotion MI was calculated for each non-VIP neuron separately for epochs either with optogenetic VIP-IN activation (Loc + VIPstim) or without (Loc) compared with quiet wakefulness with no VIP-IN activation. Seventy-six percent of non-VIP neurons show a greater locomotion MI with concurrent VIP-IN activation, while 78% of p-INs have a lower (more negative) MI (inset histogram).
(F) Average locomotion MI for all non-VIP neurons and p-IN with or without VIP-IN stimulation. Lines represent the average response of all cells in individualScn1a+/− mice, and bars represent the grand average across mice.
n = 3,246 non-VIP and 69 VIP cells from N = 5 Scn1a+/− mice (2 male, 3 female). Within-group comparisons were made with a paired Student’s t test using the average of each mouse. See also Figure S8.
