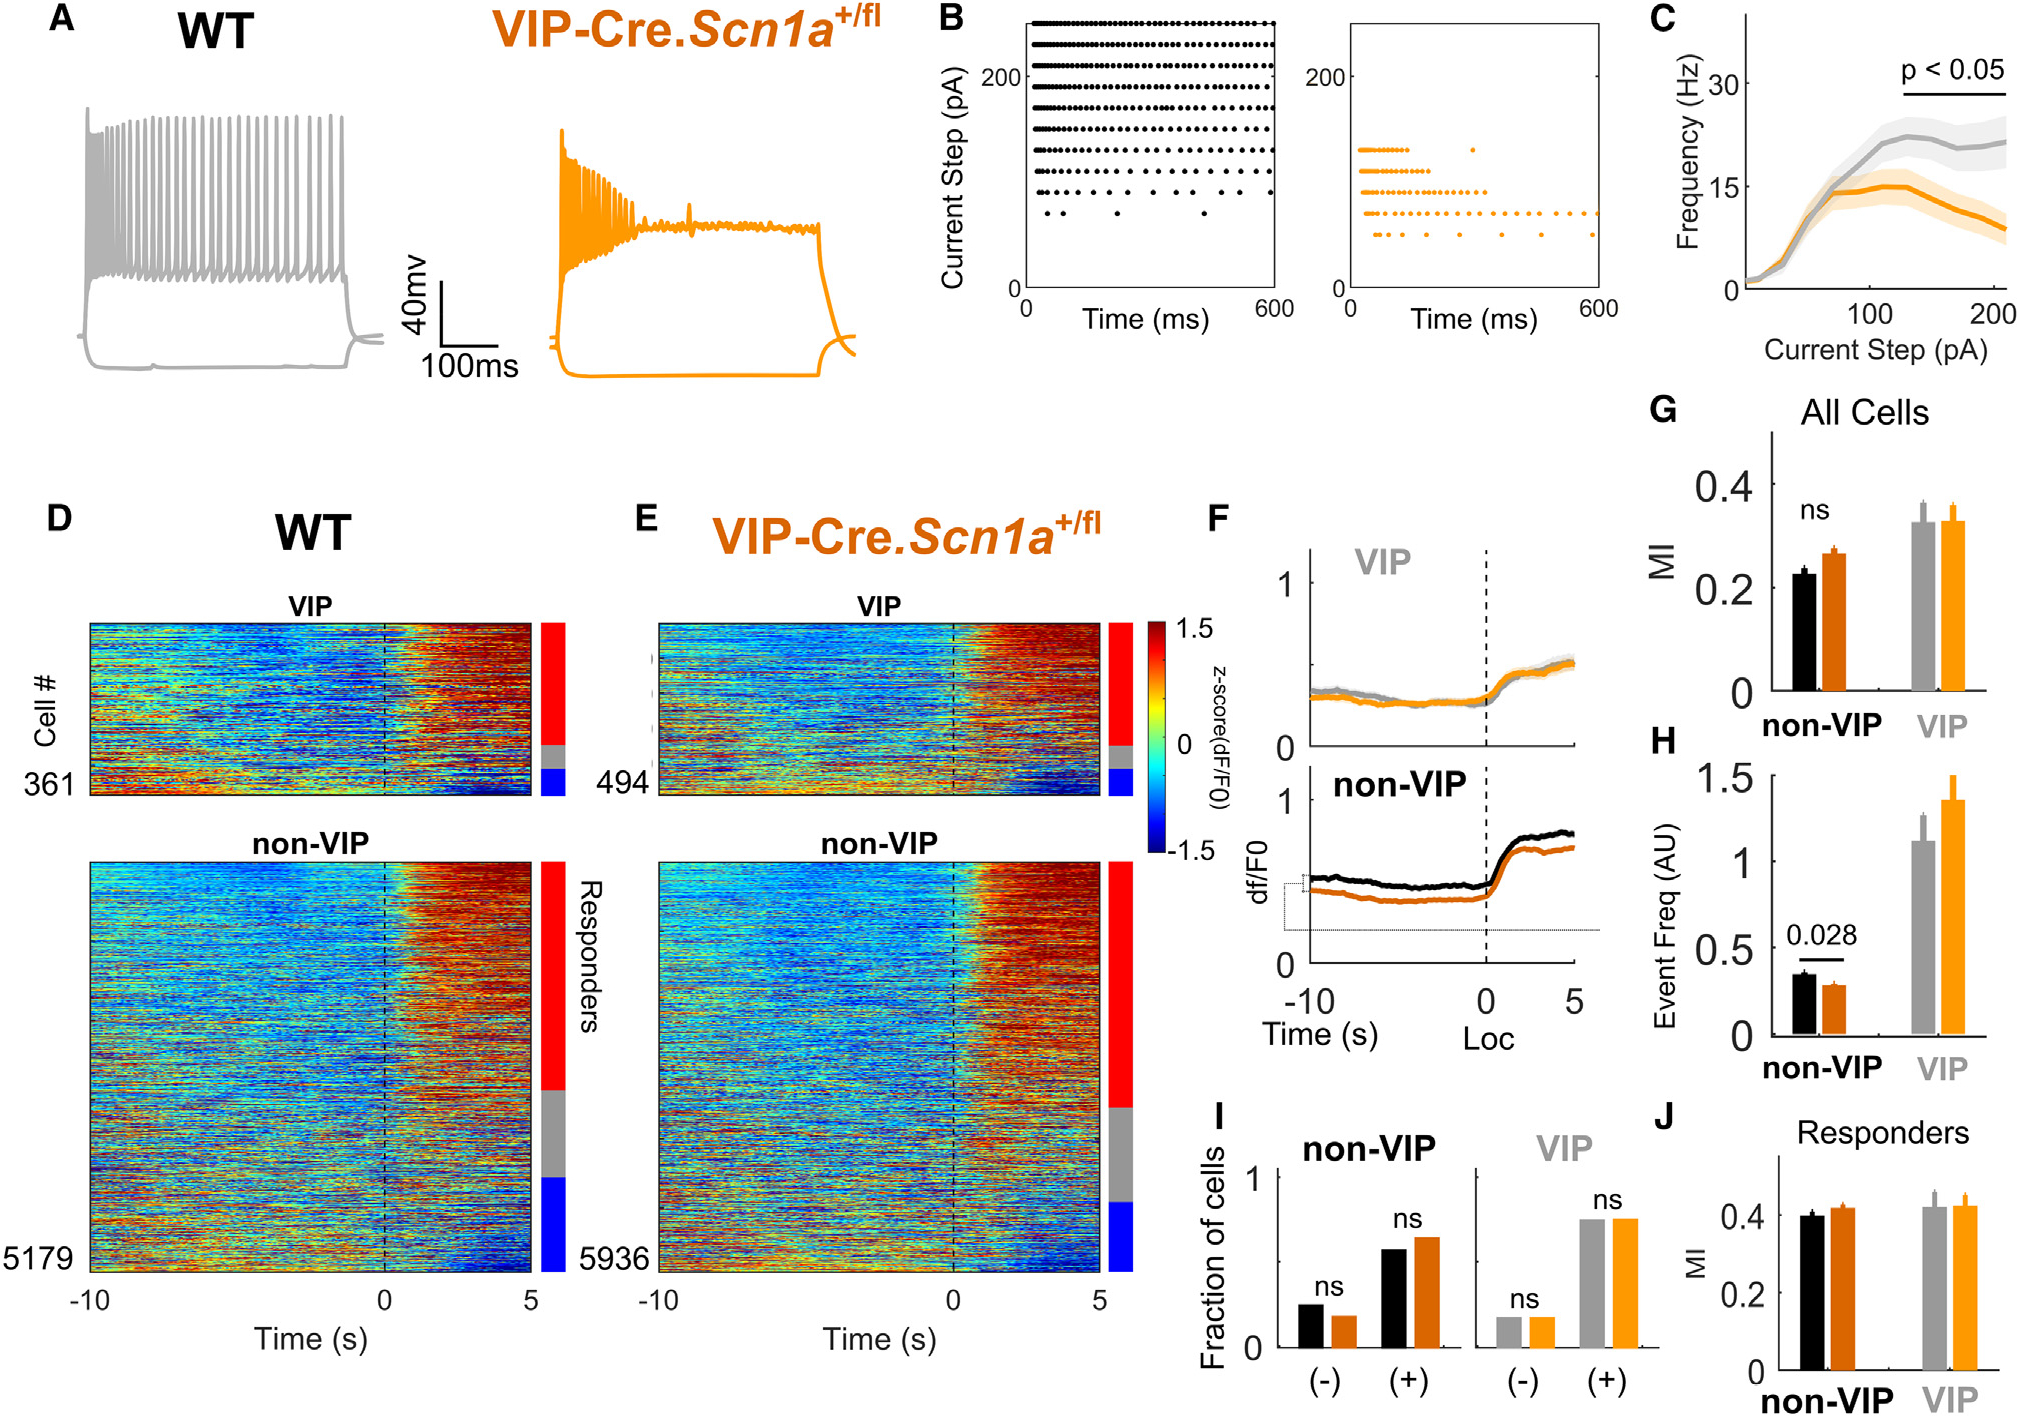
Figure 4. Loss of Scn1a in VIP-INs reproduces in vitro physiology with no overt circuit deficit.

(A) Representative traces of the voltage response of an individual VIP-IN to a 600-ms square depolarizing current at 2× rheobase. VIP-INs from Scn1a+/fl mice show action potential failure and depolarization block.
(B) Raster plots of the action potentials fired by the cells in (A) during the full series of 600-ms current injections from 0 to 250 pA. Each dot represents an action potential. The Scn1a+/fl cell enters depolarization block starting at 100 pA, while the WT VIP-IN continues firing past 250 pA.
(C) Current-frequency relationship for all cells recorded as in (A) and (B). n = 30 VIP-INs from four VIP-Cre.Scn1a+/fl mice, and n = 27 VIP-INs from four WT mice. See Figure S7 for additional parameters of repetitive firing and single action potential generation.
(D) Heatmap showing activity for each cell at the onset of locomotion bouts, as in Figure 2C. Bars show percentage of activated (red, responders) and inhibited (blue) cells.
(E) Same as (D), for Scn1a+/fl mice.
(F) Average dF/F0 for all VIP-INs (light shades) and non-VIP neurons (dark shades) aligned to locomotion onset (Loc) in WT (grayscale) and Scn1a+/fl mice (orange) (as in Figure 2E). Lines and shaded area represent mean ± 95% CI.
(G) Locomotion MI as in Figure 2F.
(H) Deconvolved event frequency during stationary epochs (as in Figure S3C).
(I) Fraction of cells either activated (+) or inhibited (−) at the onset of locomotion by genotype. Responders were determined compared with shuffled data as in Figure 2G and STAR Methods.
(J) MI of cells activated during locomotion (responders), as in Figure 2H.
For (D) to (J), n = 5,179 tdT− and 361 VIP-INs from N = 6 WT (4 male, 2 female) mice; n = 5,936 tdT− and 494 VIP-INs from N = 7 Scn1a+/fl mice (3 male, 4 female). ns, not significant. See also Figure S9.
