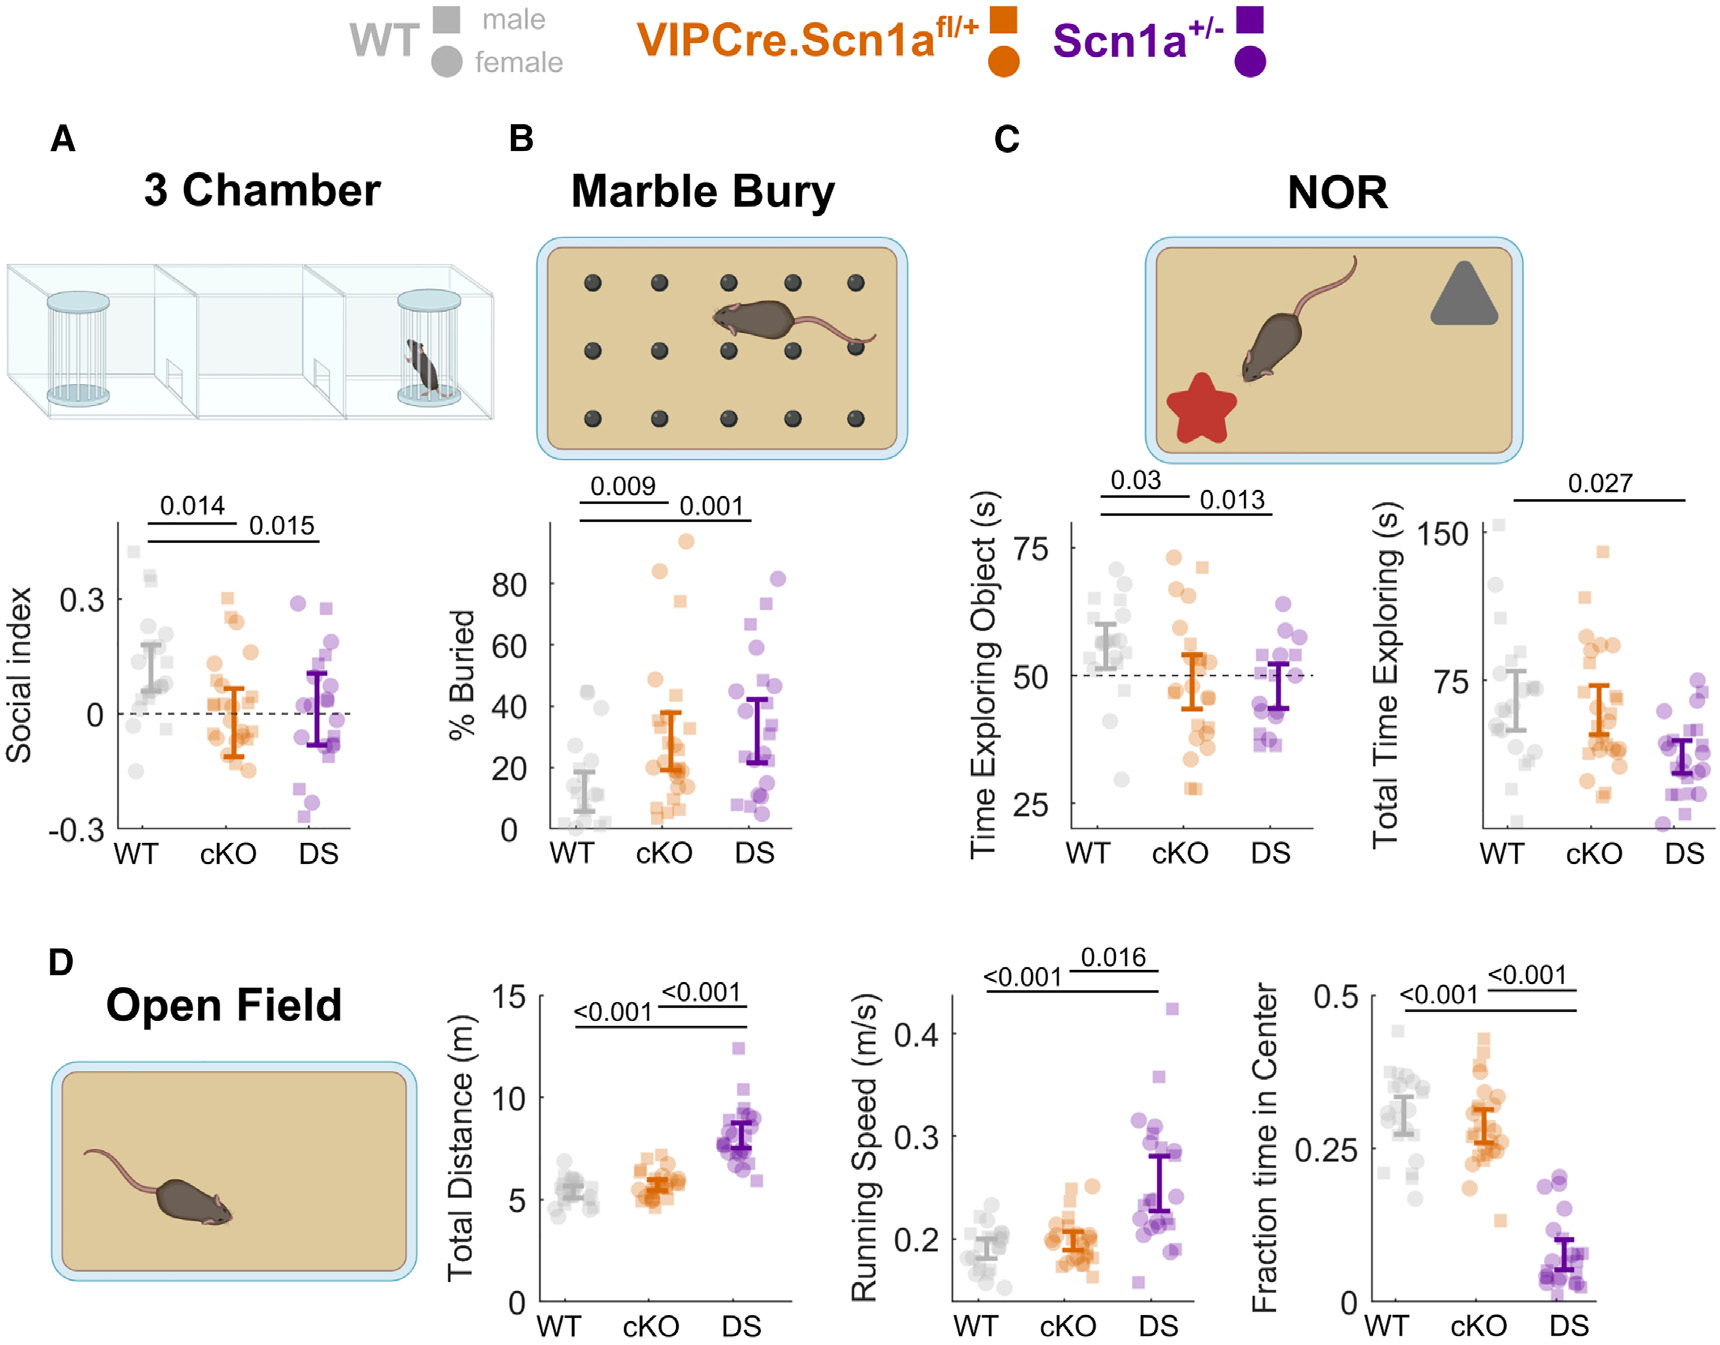
Figure 6. Loss of Scn1a in VIP-INs replicates core cognitive impairments and ASD endophenotypes of Scn1a+/− mice.

(A) Social interaction index for time spent with a novel conspecific vs. an empty enclosure in the opposite chamber (higher values indicate more time spent with the novel mouse, and index of 0 [dotted line] indicates equal time with each). Scn1afl/+ (cKO) and Scn1a+/− (DS). This result remained when instead comparing the raw time spent interacting with the novel mouse between experimental groups (Figure S10).
(B) Percentage of marbles buried during a 30-min period.
(C) Left: percent time exploring a novel vs. familiar object during the 20-s evaluation period. Right: total time spent exploring both objects during the 5-min test period.
(D) Left: total distance traveled during a 15-min open-field period. Center: maximum running speed (90th percentile of running speed during the open-field period). Right: percent time spent in the center, more than 4 cm from any edge of the arena.
Data from male (squares) and female (circles) mice are plotted separately, with error bars representing the bootstrapped 95% CI of the mean; p values represent comparisons between genotypes using a mixed-effects model with sex as a random effect. N = 26 (13 male, 13 female) VIPCre.Scn1afl/+, N = 23 (11 male, 12 female) VIPCre.Scn1a+/−, and N = 22 (12 male, 10 female) WT mice. p values indicate differences between genotype determined by linear mixed-effects modeling considering sex as a random effect. Sex had no statistically significant impact on performance of any test (STAR Methods). Diagrams created using BioRender. See also Figures S10 and S11.
