
Figure 3. Intravenous ChAdOx1 vaccination promotes tumor regression when used as part of a heterologous prime-boost vaccination strategy.
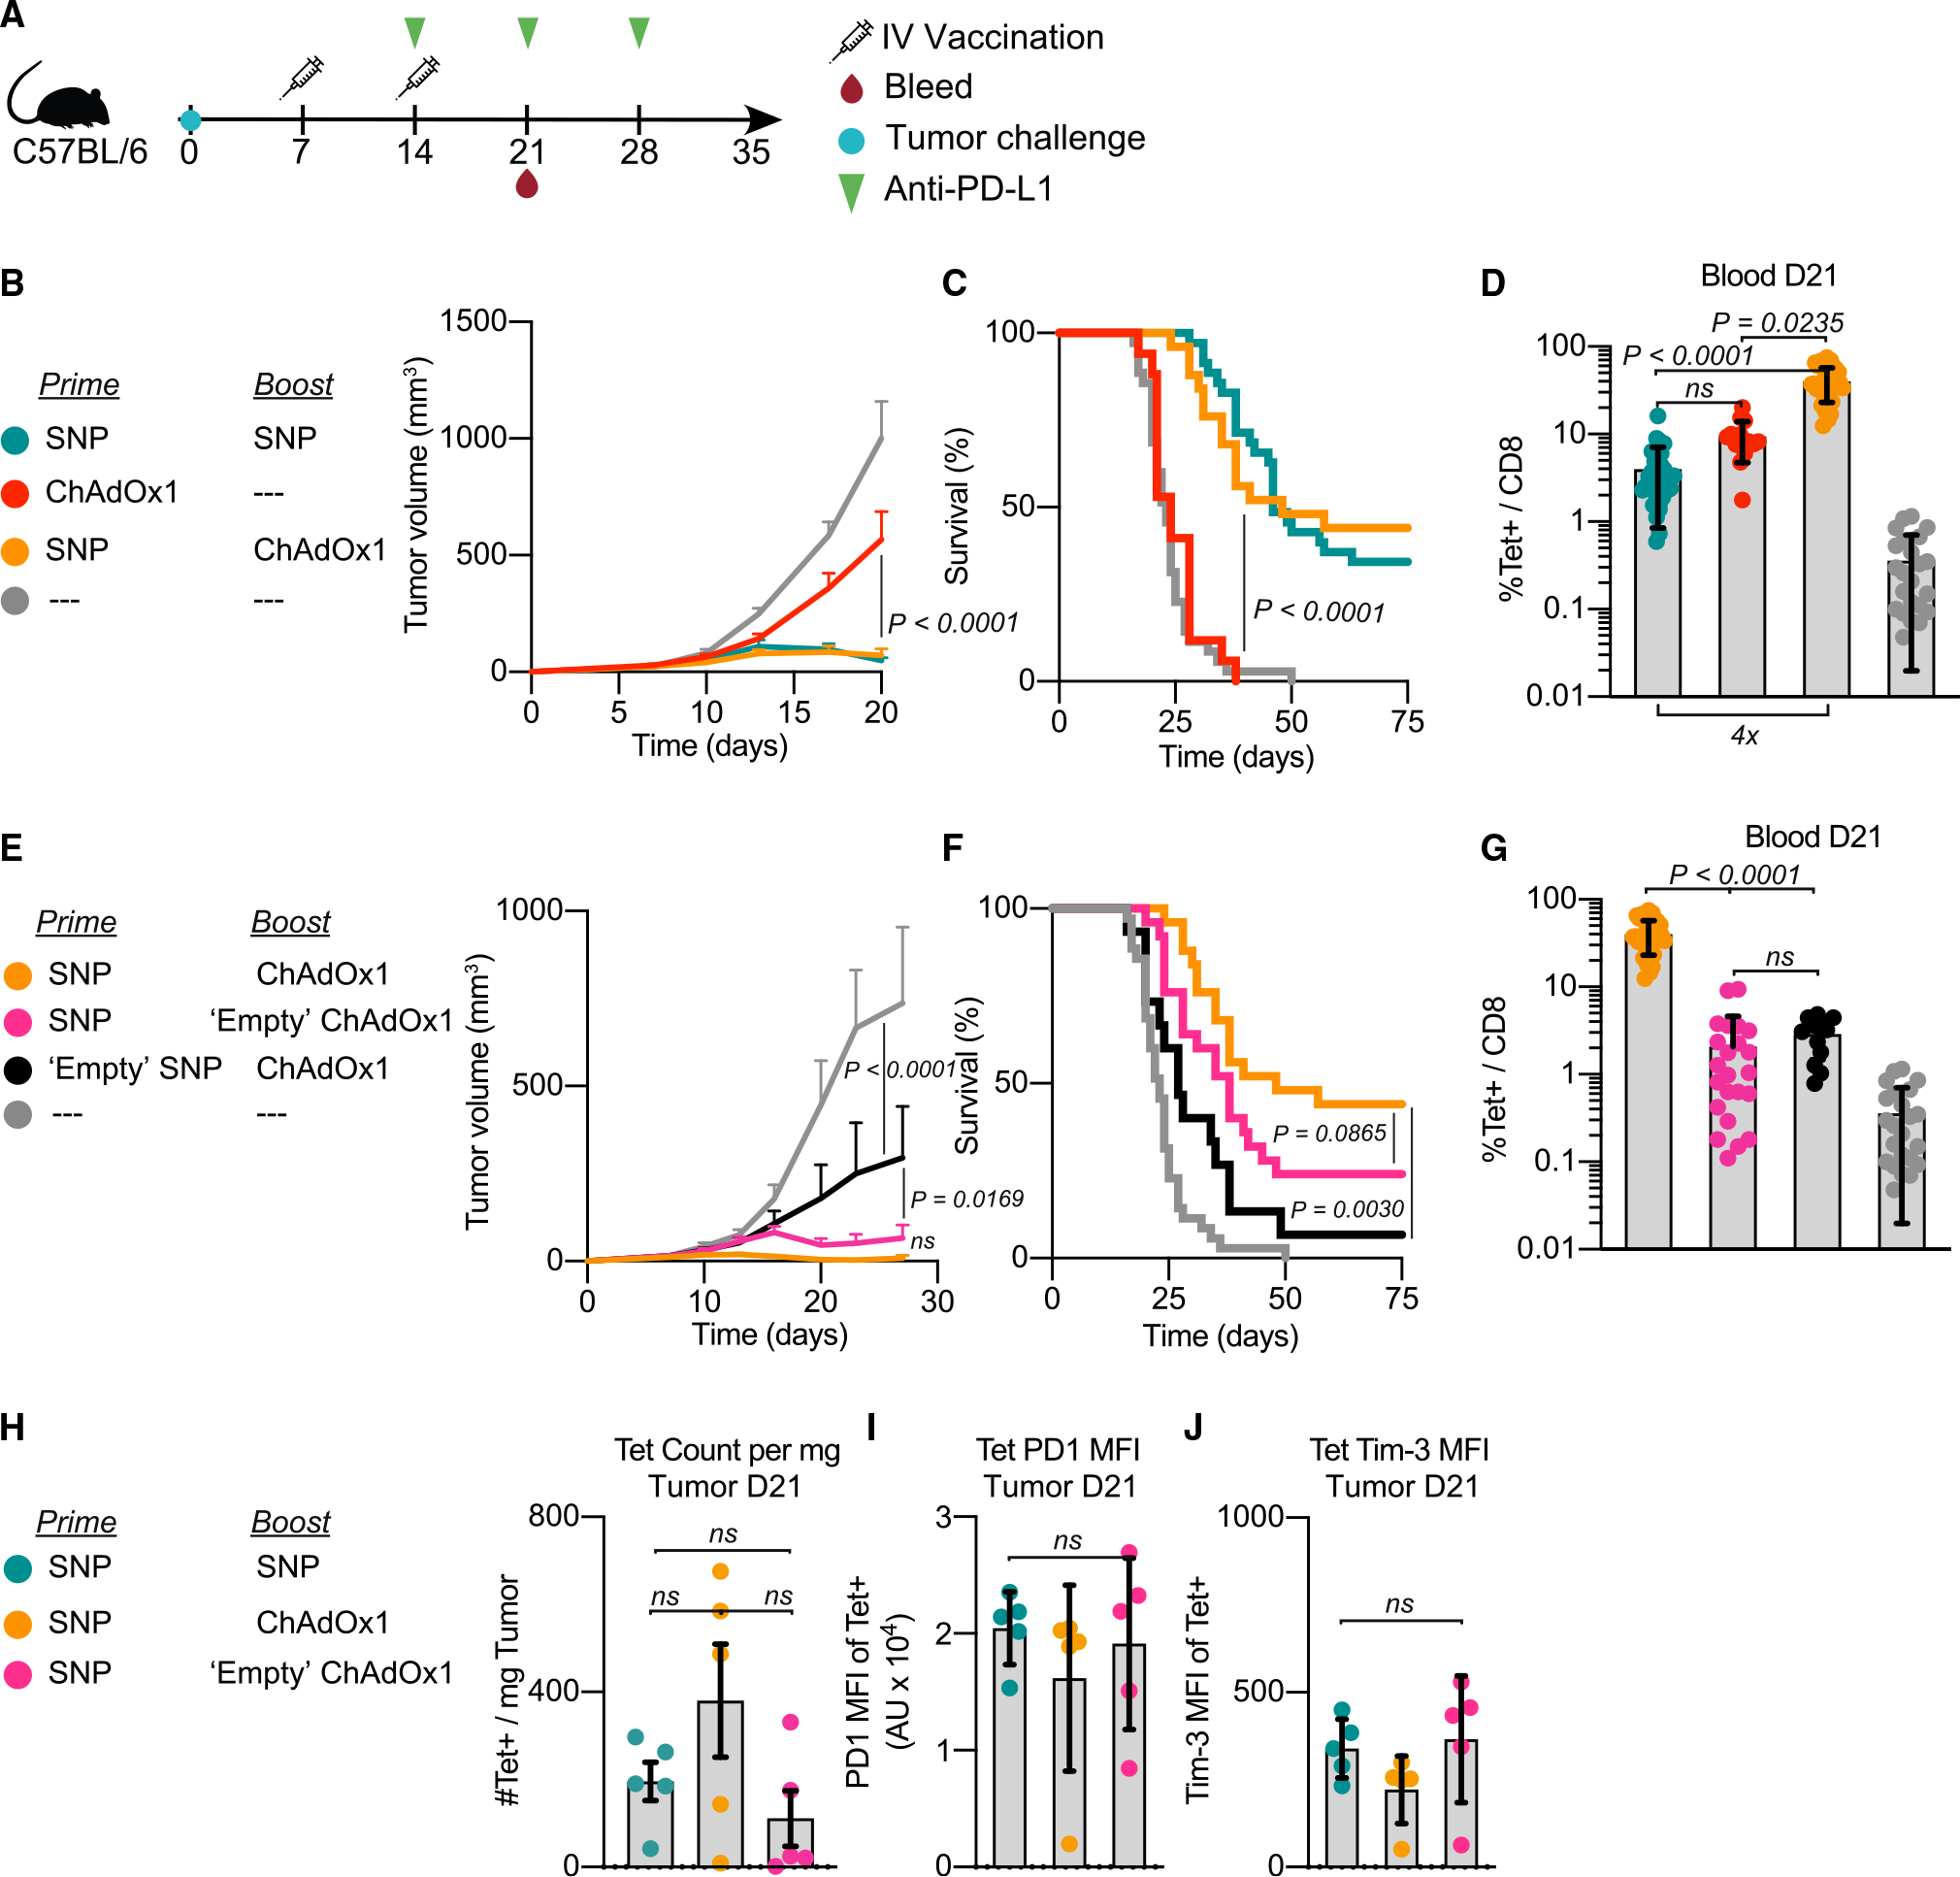
(A) Schematic of therapeutic study design. Mice were implanted with MC38 and vaccinated on days 7 and 14 with the vaccinations indicated in the legend. Mice received 3 doses of αPD-L1 administered weekly beginning on day 14. Blood, spleens, and tumors were harvested on day 21 to assess Reps1-specific CD8 T cell responses.
(B–D) Average tumor growth curves for the i.v. heterologous prime-boost group compared with the positive control (i.v. SNP given twice) and i.v. ChAdOx1 prime alone (B). Survival curve (C). Magnitude of Reps1-specific CD8 T cell responses in blood at day 21, measured by tetramer staining blood (D).
(E–G) Average tumor growth curves for the i.v. heterologous prime-boost group compared with antigen-free vaccination controls (E). Either SNP does not contain the Reps1 antigen (black) or ChAdOx1 does not contain the Reps1 antigen (pink). Survival curve (F). Magnitude of Reps1-specific CD8 T cell responses in blood at day 21, measured by tetramer staining blood (G).
(H–J) Number of Reps1-specific CD8 T cells per mg of tumor tissue processed in groups with equivalent efficacy (H). MFI of PD-1 (I) or Tim-3 (J) on Reps1-specific CD8 T cells in the tumor at day 21.
In (B) and (E), two-way ANOVA with Bonferroni correction for multiple comparisons, p values compared with naive mice. In (C) and (F), Mantel-Cox log-rank test, groups compared as indicated in figure by paired legend color-matched circles. In (D) and (G–J), data represented as mean ± SD; Kruskal-Wallis test with Dunn’s correction for multiple comparisons. In (B)–(G), n = 8 or 9, and data are representative of 2 or 3 experimental replicates per group. In (C), (D), (F), and (G), data from all replicates are merged. In (H)–(J), n = 5 and representative of 2 replicates.