
Figure 5. Interferon alpha is required for mediating anti-tumor efficacy after ChAdOx1-i.v. treatment.
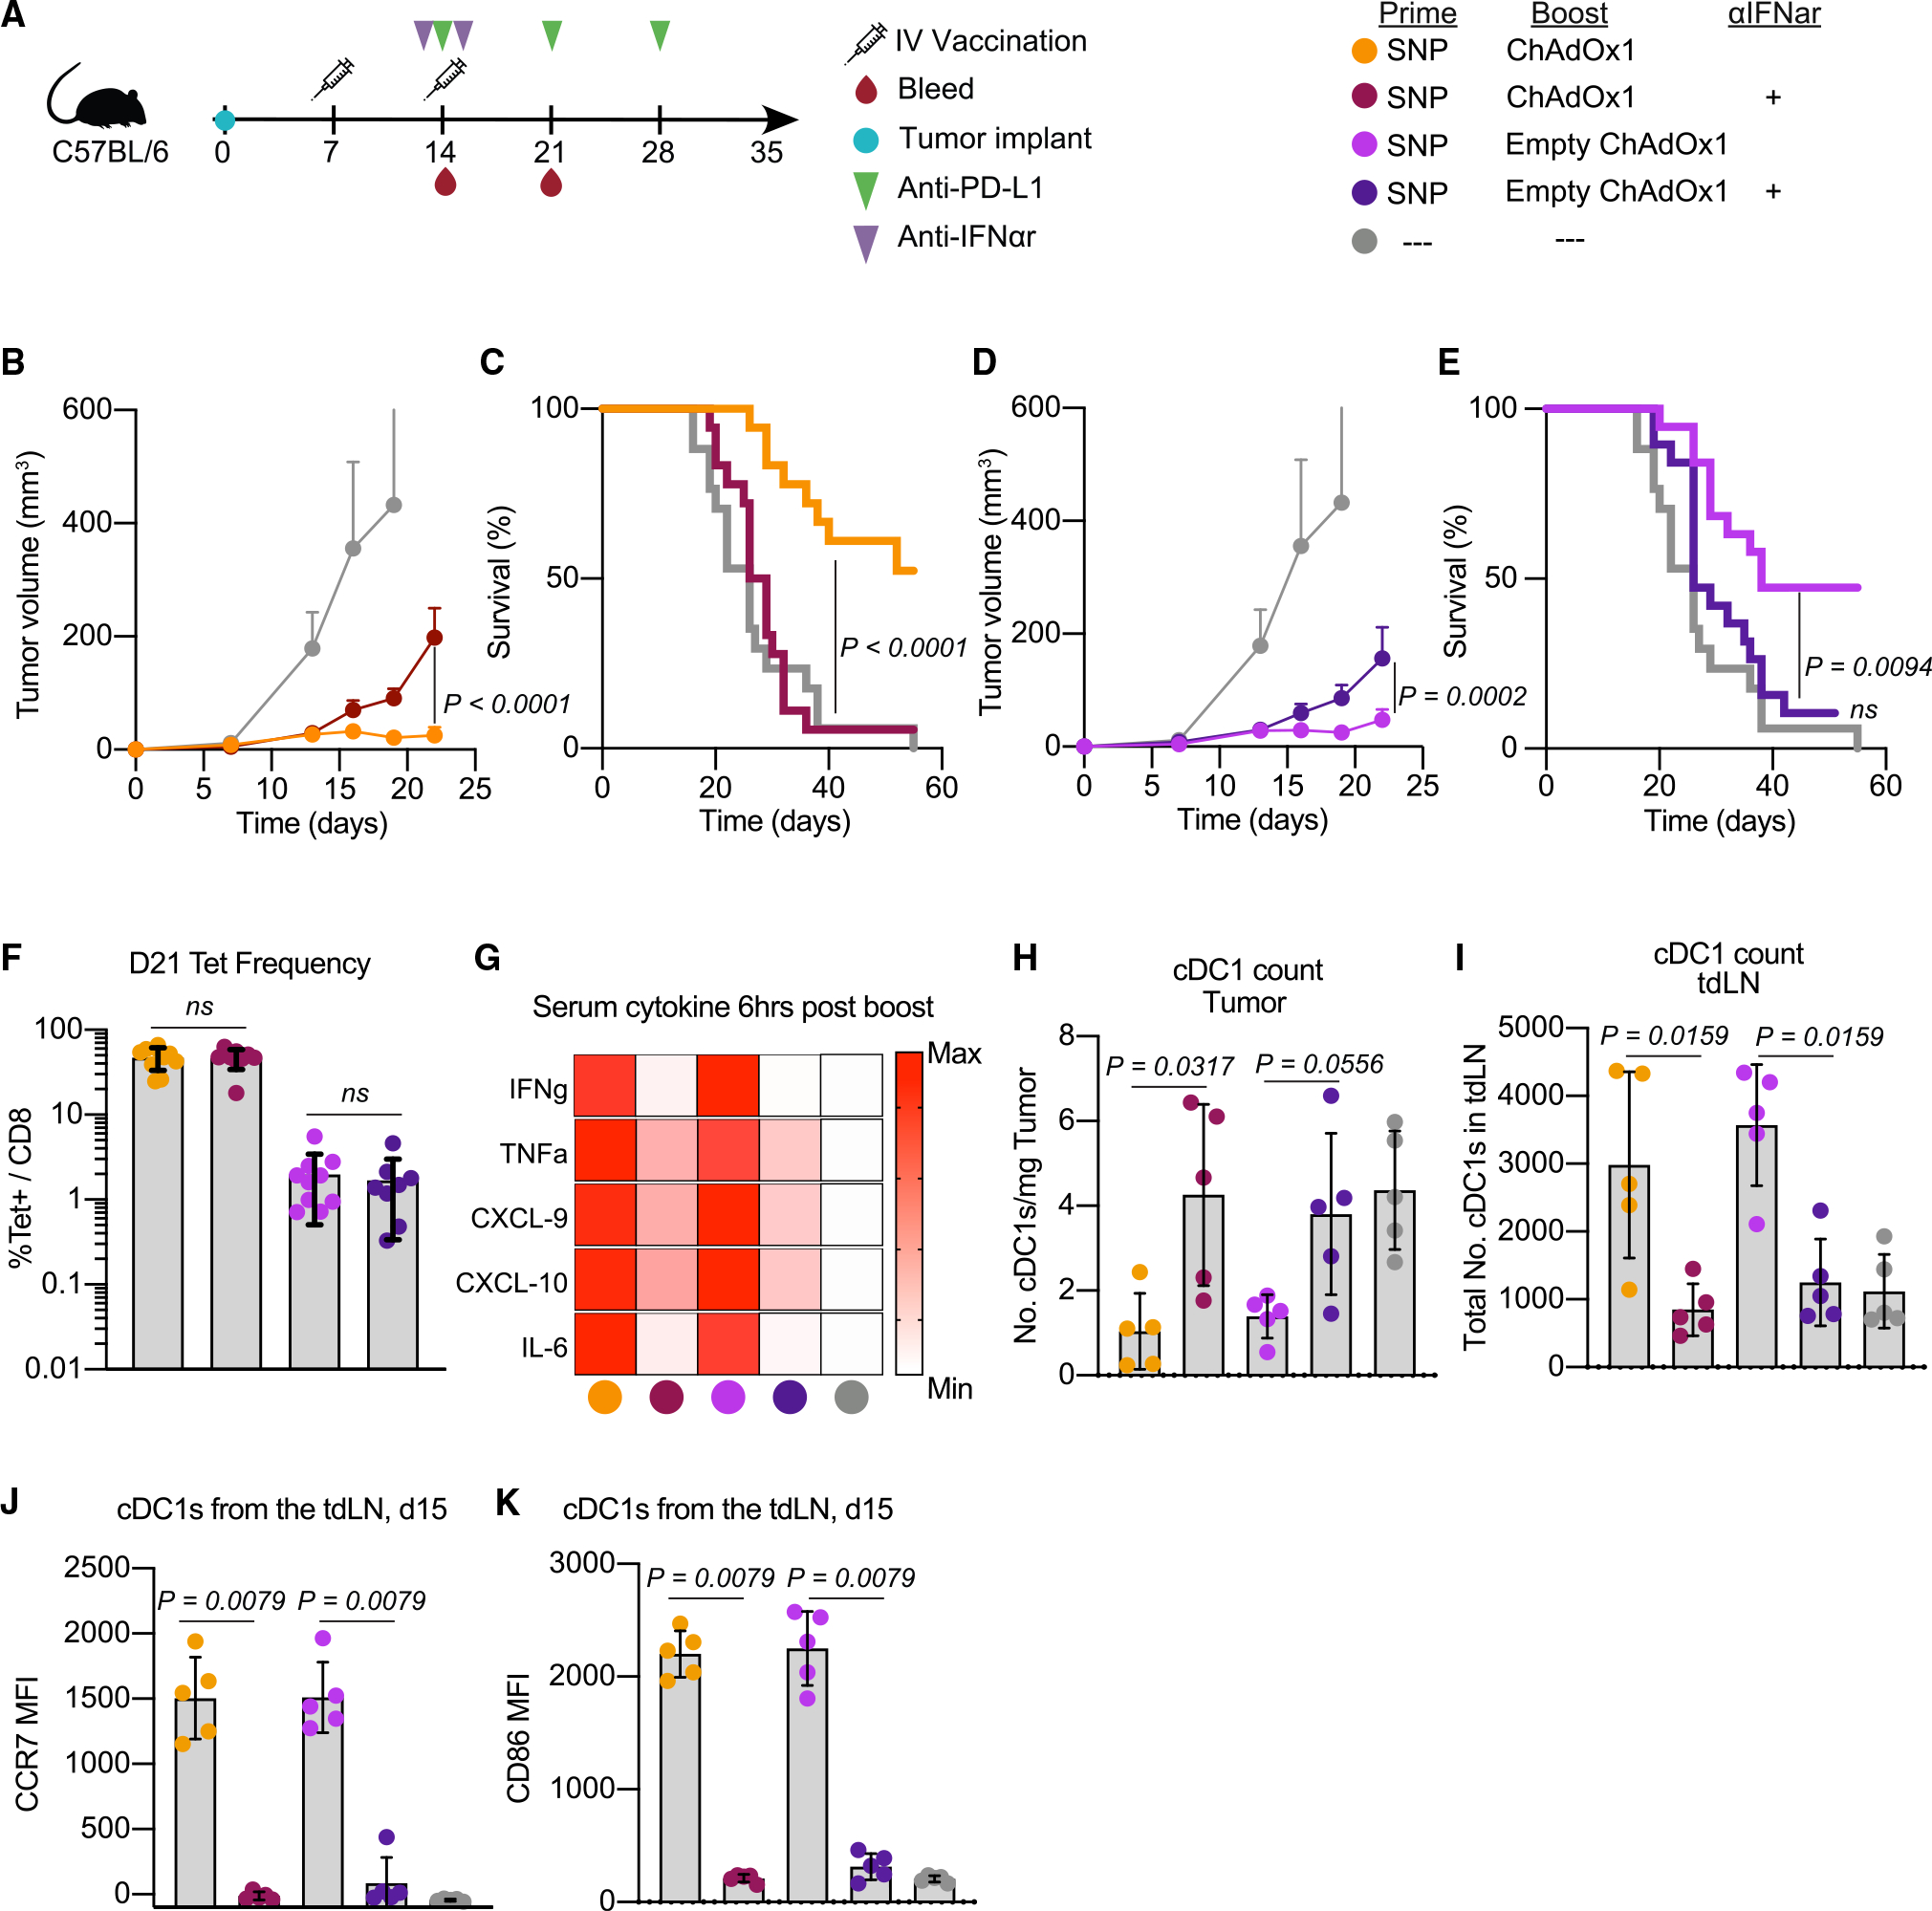
(A) Schematic of therapeutic study design as described in Figure 3. Some groups received saturating doses of IFNα receptor blocking antibody one day prior to and one day after the boost vaccination. Blood was collected on day 21 to assess Reps1-specific CD8 T cell responses. Tumor and tumor-draining lymph node (tdLN) samples were collected 1 day post-boost to assess cDC1s.
(B and D) Average tumor growth curves for the heterologous prime-boost vaccinations with either the (B) Reps1-encoding ChAdOx1 or (D) empty ChAdOx1.
(C and E) Survival curve for the heterologous prime-boost vaccination groups with either the (C) Reps1-encoding ChAdOx1 or (E) empty ChAdOx1.
(F) Magnitude of the Reps1-specific CD8 T cell response 1 week post-boost vaccination measured by tetramer staining blood.
(G) Heatmap plot of the average amount of a subset of cytokines assayed by Luminex present in serum 6 h post-boost. Scale is relative to the range for each individual cytokine.
(H) Number of cDC1s per mg of tumor found 1 day post-boost.
(I) Number of cDC1s in the tdLN 1 day post-boost.
(J and K) Expression of the maturation and migration marker (J) CCR7 and activation marker (K) CD86.
In (B) and (D), two-way ANOVA with Bonferroni correction for multiple comparisons, p values compared with naive mice unless otherwise indicated. In (C) and (E), Mantel-Cox log rank test. In (F) and (H)–(K), data represented as mean ± SD, Mann-Whitney test. In (B)–(E), n = 8 or 9, 2 experimental replicates, data for both panel sets is from the same experiments and separated into the Reps-1 encoding ChAdOx1 and empty ChAdOx1 boost for presentation purposes. In (F), n = 8–10, data representative of 2 experimental replicates. In (G)–(K), n = 5, data representative of 2 experimental replicates.