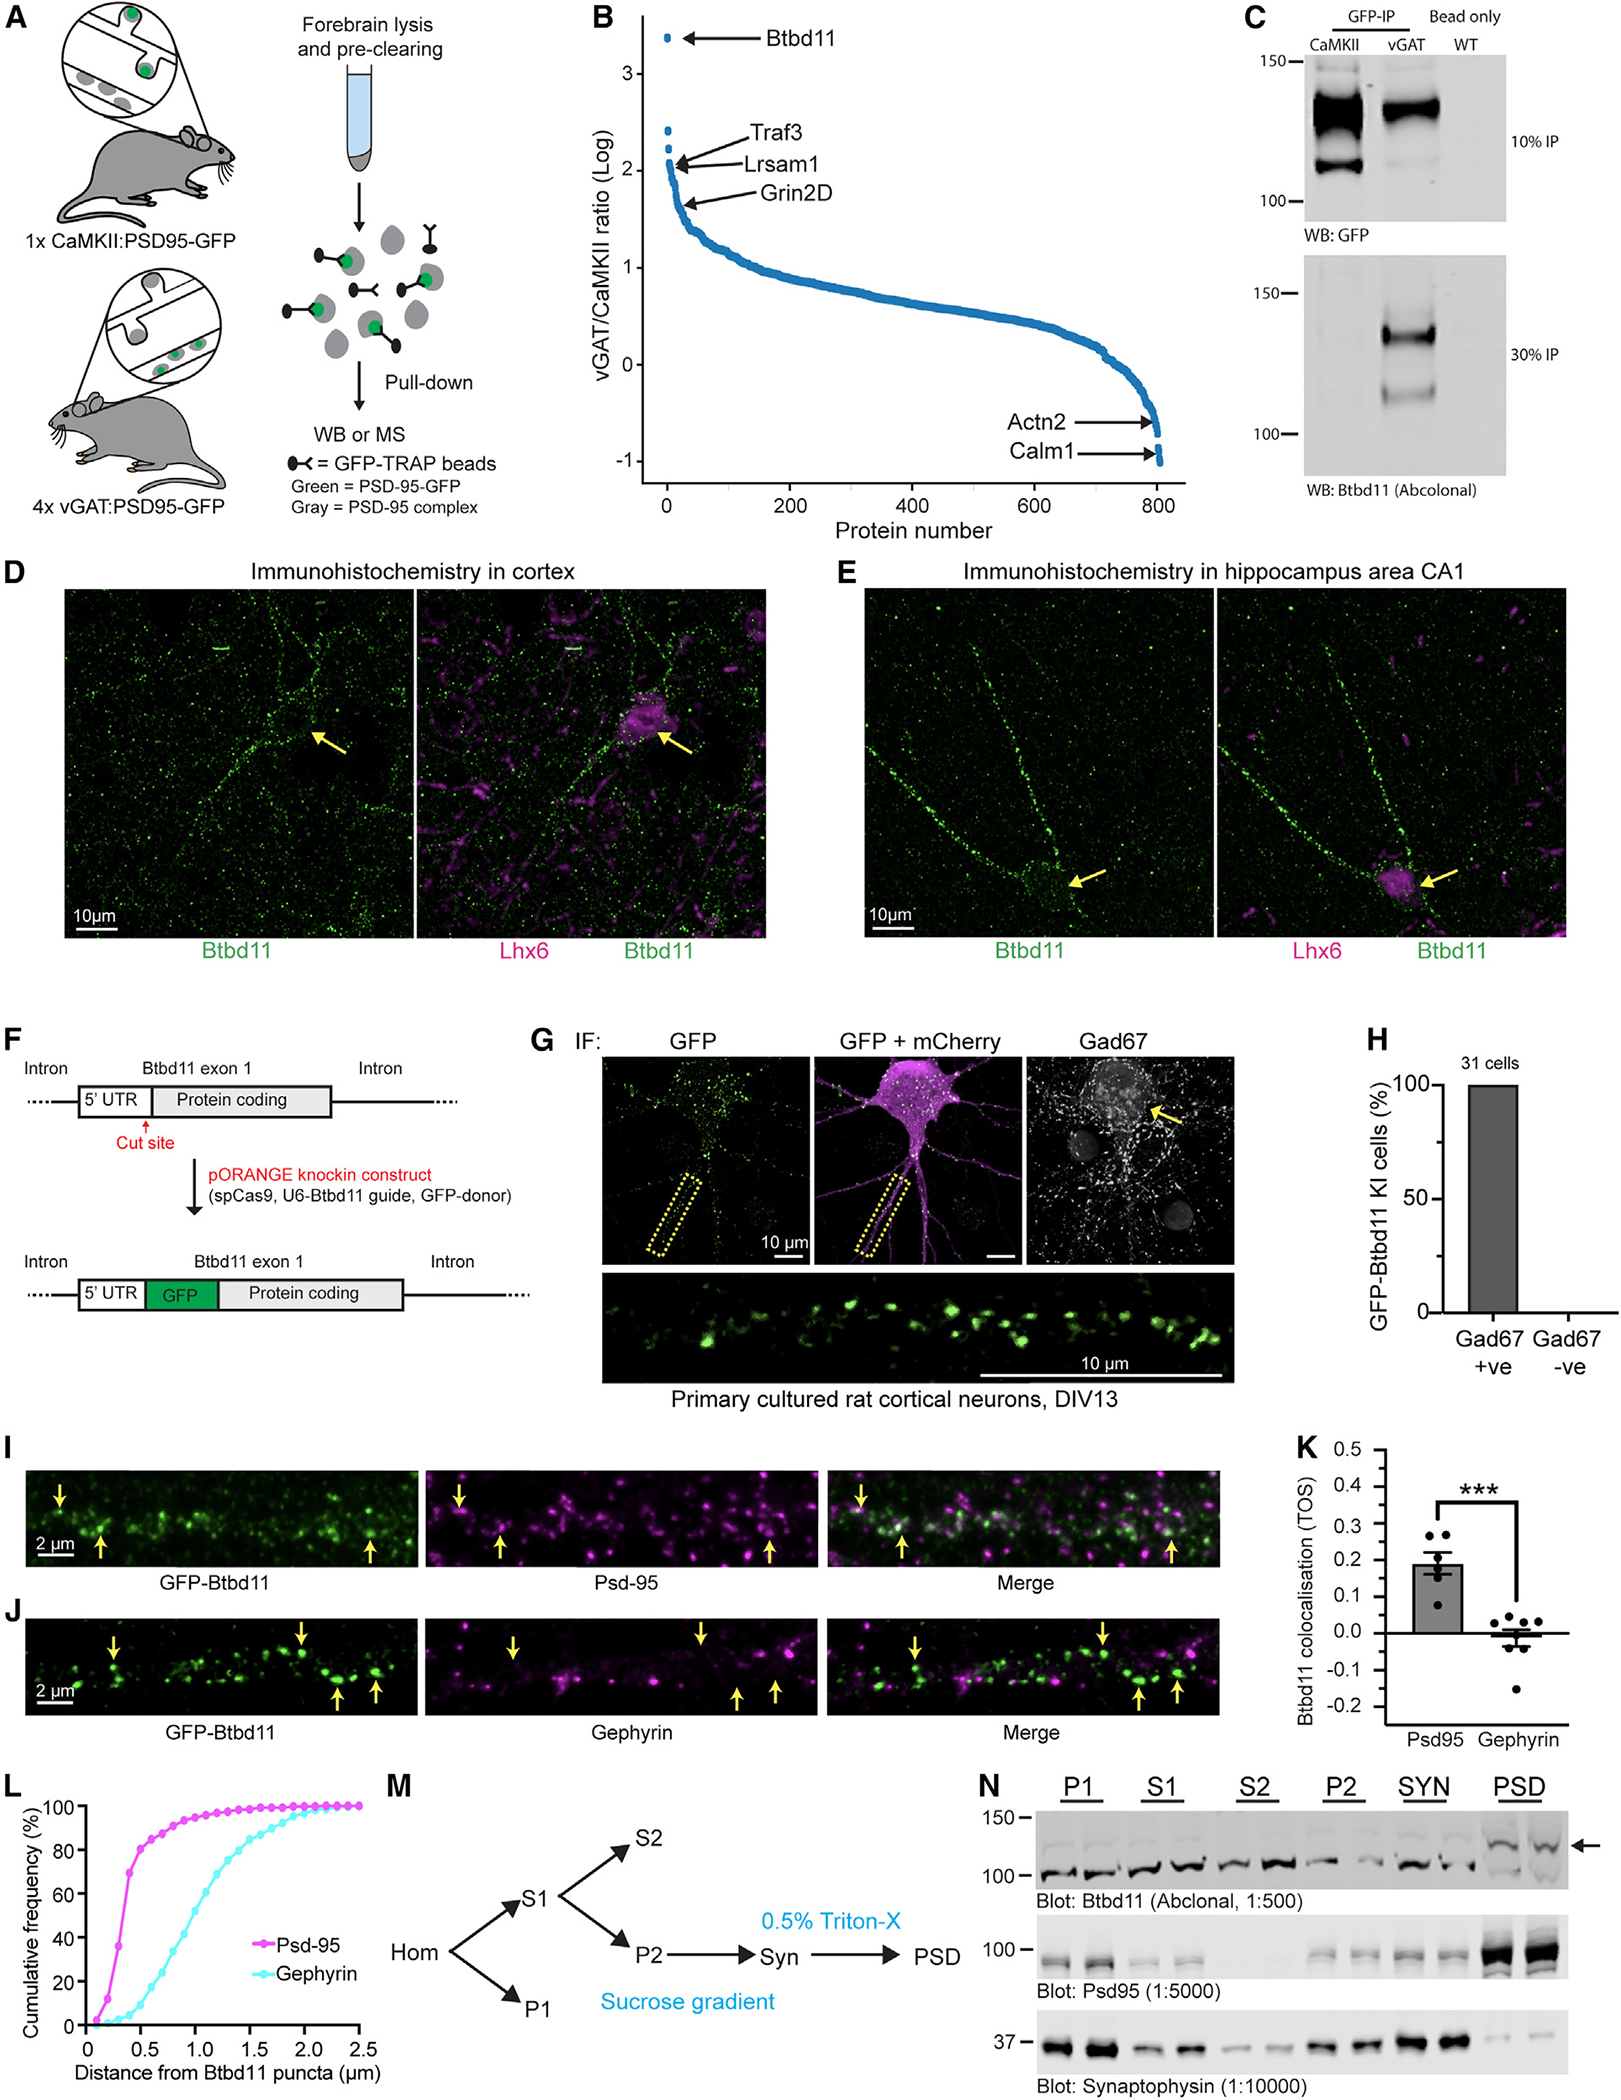
Figure 1. Identification of Btbd11 as an inPSD protein.

(A) Schematic of Psd-95-GFP knockin in CaMKII or vGAT positive neurons to label excitatory and inhibitory neurons, respectively.
(B) Proteins identified using semi-quantitative mass spectrometry.
(C) Psd-95-GFP immuno-isolation with CaMKII:Psd-95-GFP and 4× vGAT:Psd-95-GFP mice (pooled) or a WT animal used for a bead-only control followed by western blots for GFP (detecting Psd-95-GFP, the “bait”) from 10% of the pull-down or Btbd11 (a candidate inPSD) from 30% of the pull-down material. This is a representative example of an experiment conducted 3 times.
(D and E) Immunohistochemistry in WT mouse brain slices for Btbd11 (green) or Lhx6 (magenta) in layer 2/3 of the visual cortex (D) and area CA1 (E) of the hippocampus. Note the Btbd11-positive cells are expressing Lhx6, a marker for somatostatin and parvalbumin inhibitory interneurons.
(F) Schematic of the CRISPR knockin strategy used to label endogenous Btbd11.
(G) Example of GFP-Btbd11 knockin cell from primary cultured rat cortical neurons electroporated with knockin constructs and a mCherry cell fill (magenta). Immunofluorescence was used to boost the GFP-Btbd11 signal (green) and to identify GAD67-positive INs. Yellow arrow indicates a GAD67-positive cell. The area in the yellow dotted box is enlarged to show the GFP-Btbd11 signal. Respective scale bars indicate 10 μm.
(H) All 31 GFP-Btbd11 knockin cells were also GAD67 positive.
(I and J) Zoom in along the dendrites of GFP-Btbd11 knockin cells with immunofluorescence for Psd-95 or gephyrin, respectively. Yellow arrows indicate a subset of Btbd11 puncta. Scale bars indicate 2 μm.
(K) Co-localization of GFP-Btbd11 puncta (identified with CRISPR knockin [KI]) with Psd-95 and gephyrin (visualized with immunofluorescence) using the threshold overlap score (TOS). Bars indicate the mean, and error bars show the SEM. ***p < 0.001.
(L) Cumulative frequency plots indicating the puncta-to-puncta distance of Btbd11 with Psd-95 (magenta) or gephyrin (blue).
(M) Schematic of the fractionation protocol used to isolate the postsynaptic density (PSD) from mouse cortex. P1, crude nuclear; S1 and S2, supernatant; P2, crude synaptosomal pellet; Syn, synaptosomes; PSD, postsynaptic density.
(N) Western blot analysis of Btbd11 levels (top blot, 12 μg protein loaded) in different biochemical fractions of WT animals (1 male and 1 female, 3 months). Note the enrichment of Btbd11 in the PSD fraction. The band corresponding to Btbd11 is indicated with a black arrow (predicted weight 121.6 kDa). The fractionation efficiency was demonstrated with blots for Psd-95 (middle blot, enrichment in PSD) and synaptophysin (bottom blot, enrichment in SYN) with 2 μg protein loaded for each. See Table S2 for full statistical information on all tests.
