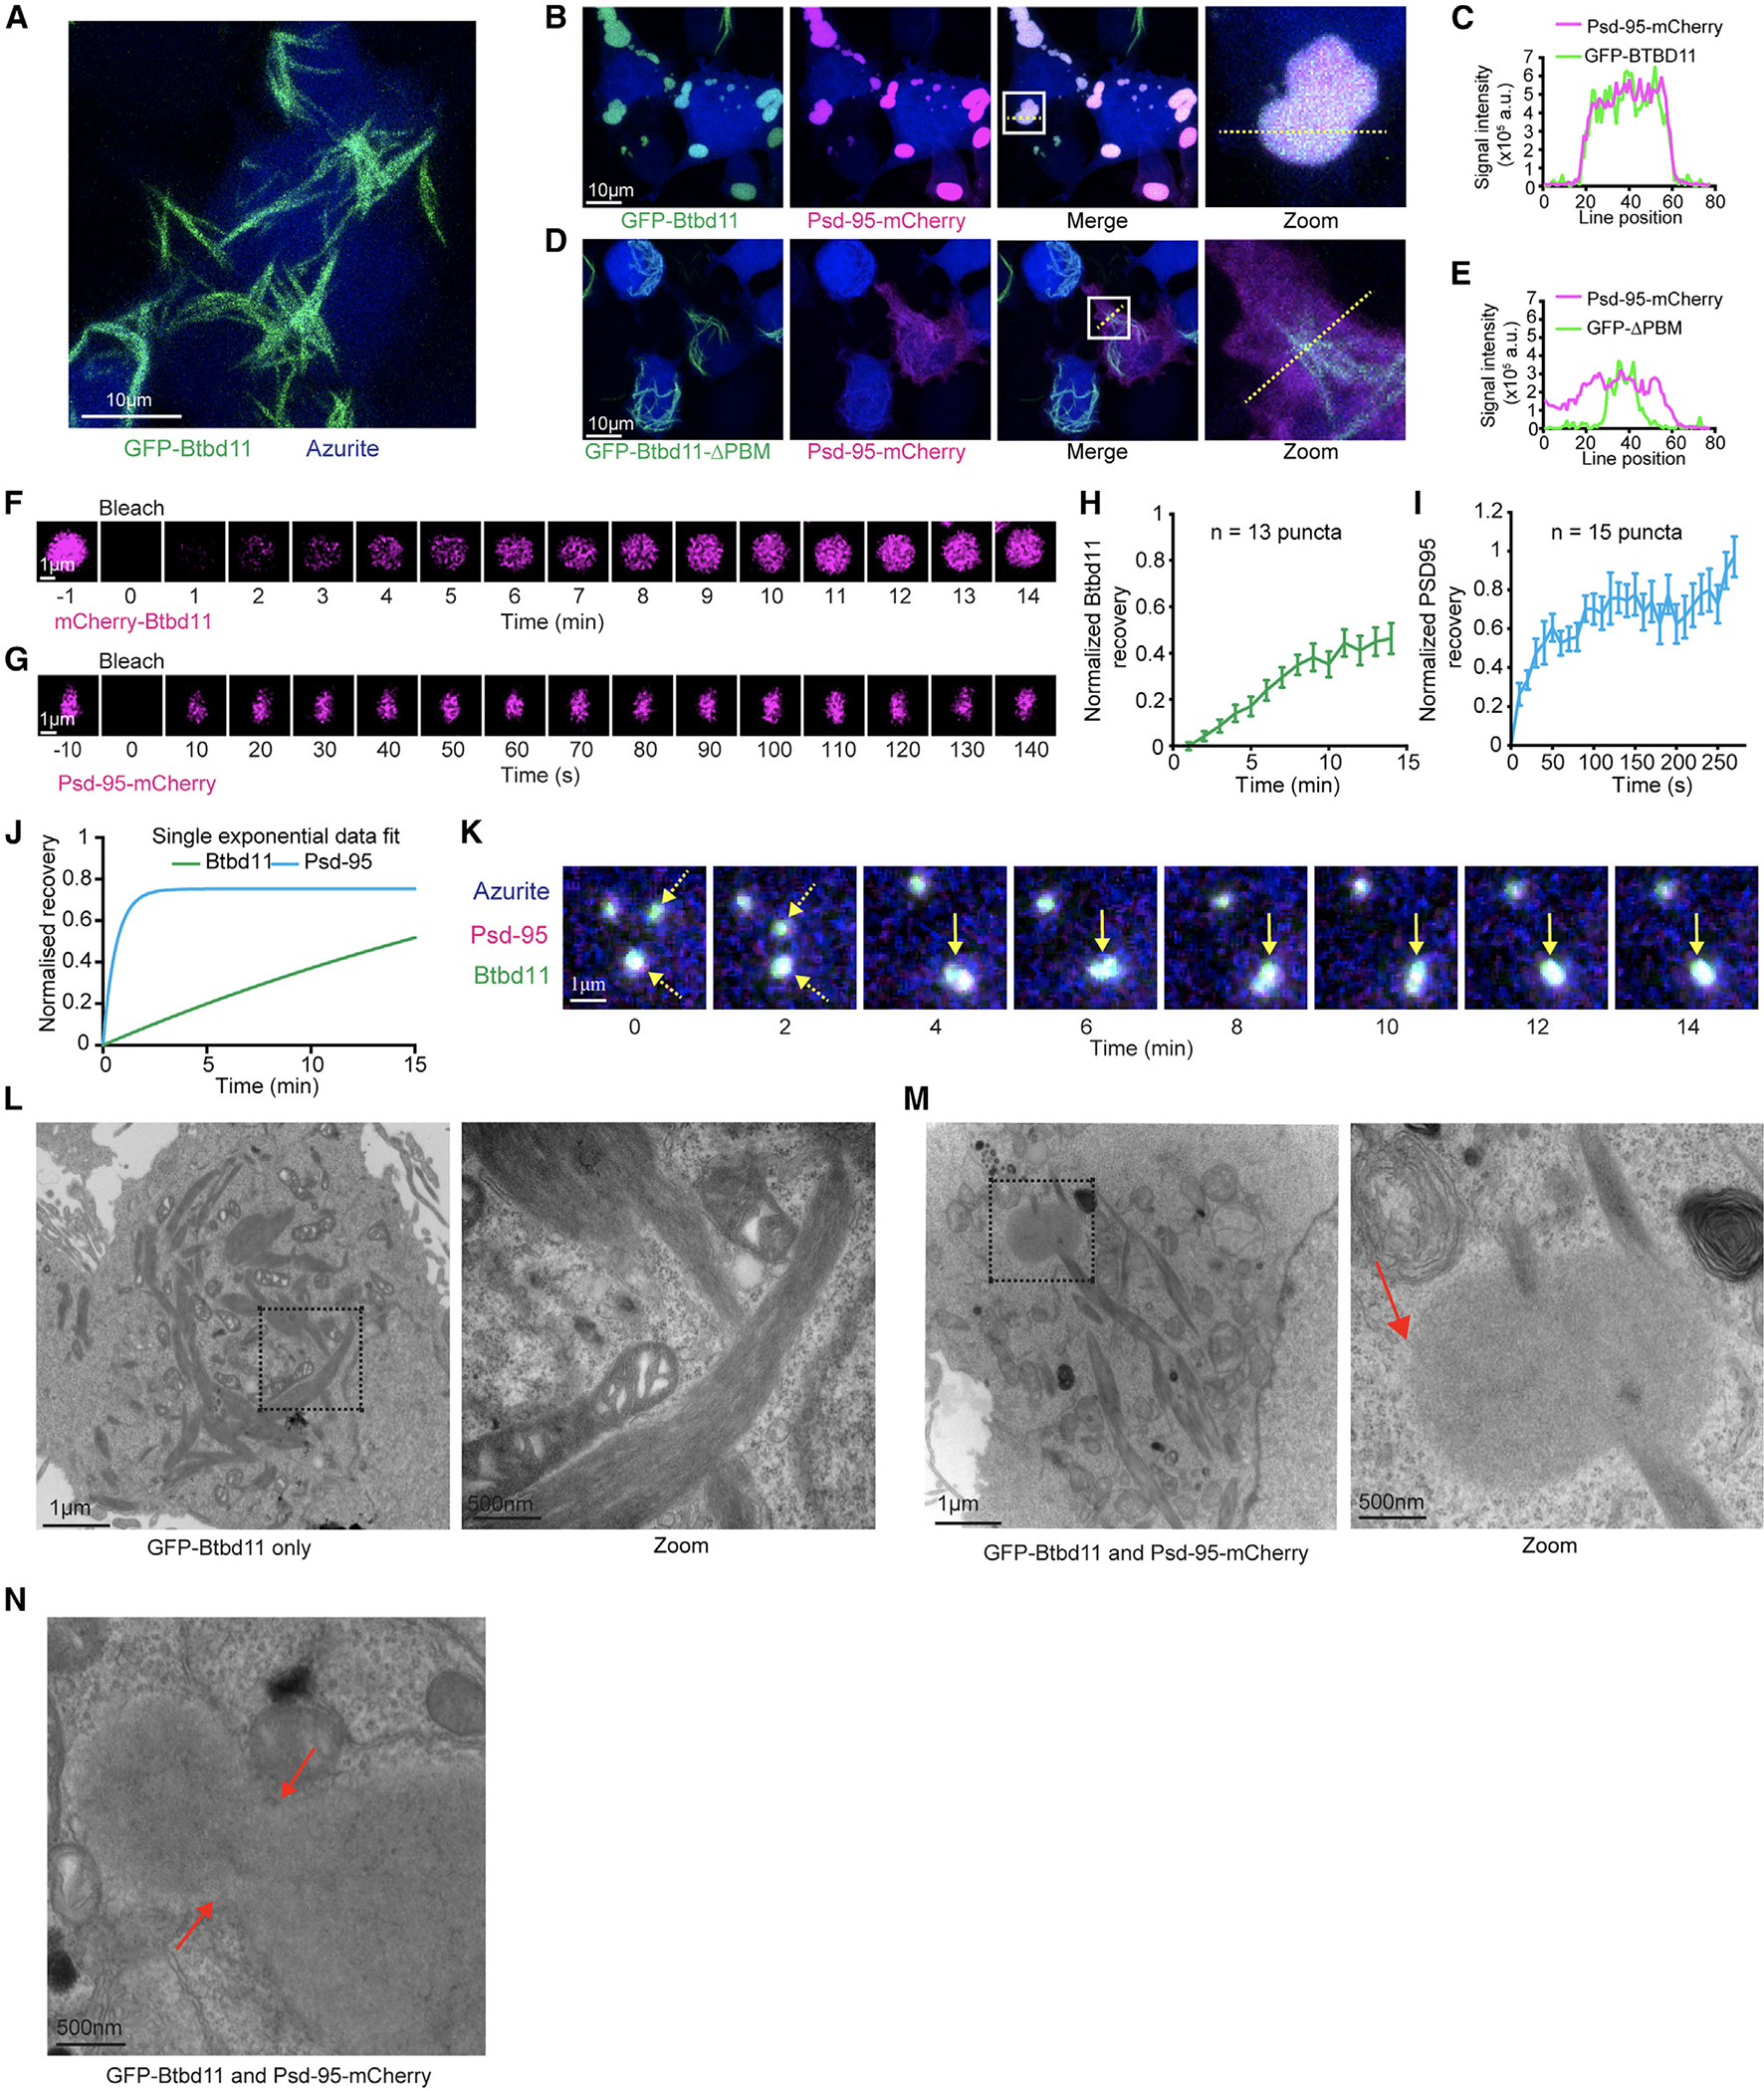
Figure 3. Liquid-liquid phase separation of Btbd11 when expressed with Psd-95.

(A) Expression of GFP-Btbd11 (green) and an azurite cell fill (blue) in HEK cells led to the formation of large fibril-like assemblies. Scale bar: 10 μm.
(B and C) Co-expression of GFP-Btbd11 (green) with Psd-95-mCherry (magenta) and an azurite cell fill (blue). The region within the white box is enlarged on the right (zoom), and the yellow dotted line indicates where a line scan (C) is shown for Psd-95-mCherry and GFP-Btbd11.
(D and E) Co-expression of GFP-Btbd11ΔPBM (green) with Psd-95-mCherry (magenta) and an azurite cell fill (blue). The region within the white box is enlarged on the right (zoom), and the yellow dotted line indicates where a line scan (E) is shown for Psd-95-mCherry and GFP-Btbd11ΔPBM.
(F and G) Fluorescence recovery after photobleaching (FRAP) of mCherry-Btbd11 and Psd-95-mCherry co-expressed with Psd-95-GFP and GFP-Btbd11, respectively. Note the difference in timescales for Btbd11 and Psd-95. Scale bar: 1 μm.
(H and I) Quantification of fluorescence recovery for Btbd11 (n = 13) and Psd-95 (n = 15), respectively. Error bars indicate SEM.
(J) Plot of the exponential fit of FRAP data for Btbd11 (green) and Psd-95 (blue).
(K) Longitudinal confocal imaging of a HEK cell transfected with GFP-Btbd11 (green), Psd-95-mCherry (magenta), and an azurite cell fill (blue). Yellow dotted arrows indicate two puncta that come together and form a single droplet (solid yellow arrow). Scale bar: 1 μm.
(L and M) Electron microscope images of HEK cells transfected with GFP-Btbd11 or GFP-Btbd11 and Psd-95-mCherry, respectively. The black dotted box is enlarged on the right of each panel. Respective scale bars are indicted at the bottom left of each image. In (M), the red arrow indicates a putative droplet observed with Btbd11 and Psd-95 co-expression but not with Btbd11 expression alone.
(N) An example of a putative Btbd11 and Psd-95 droplet that looks to be in the process of fusion or fission with red arrows indicating the neck. Respective scale bars are indicated at the bottom left of each image.
