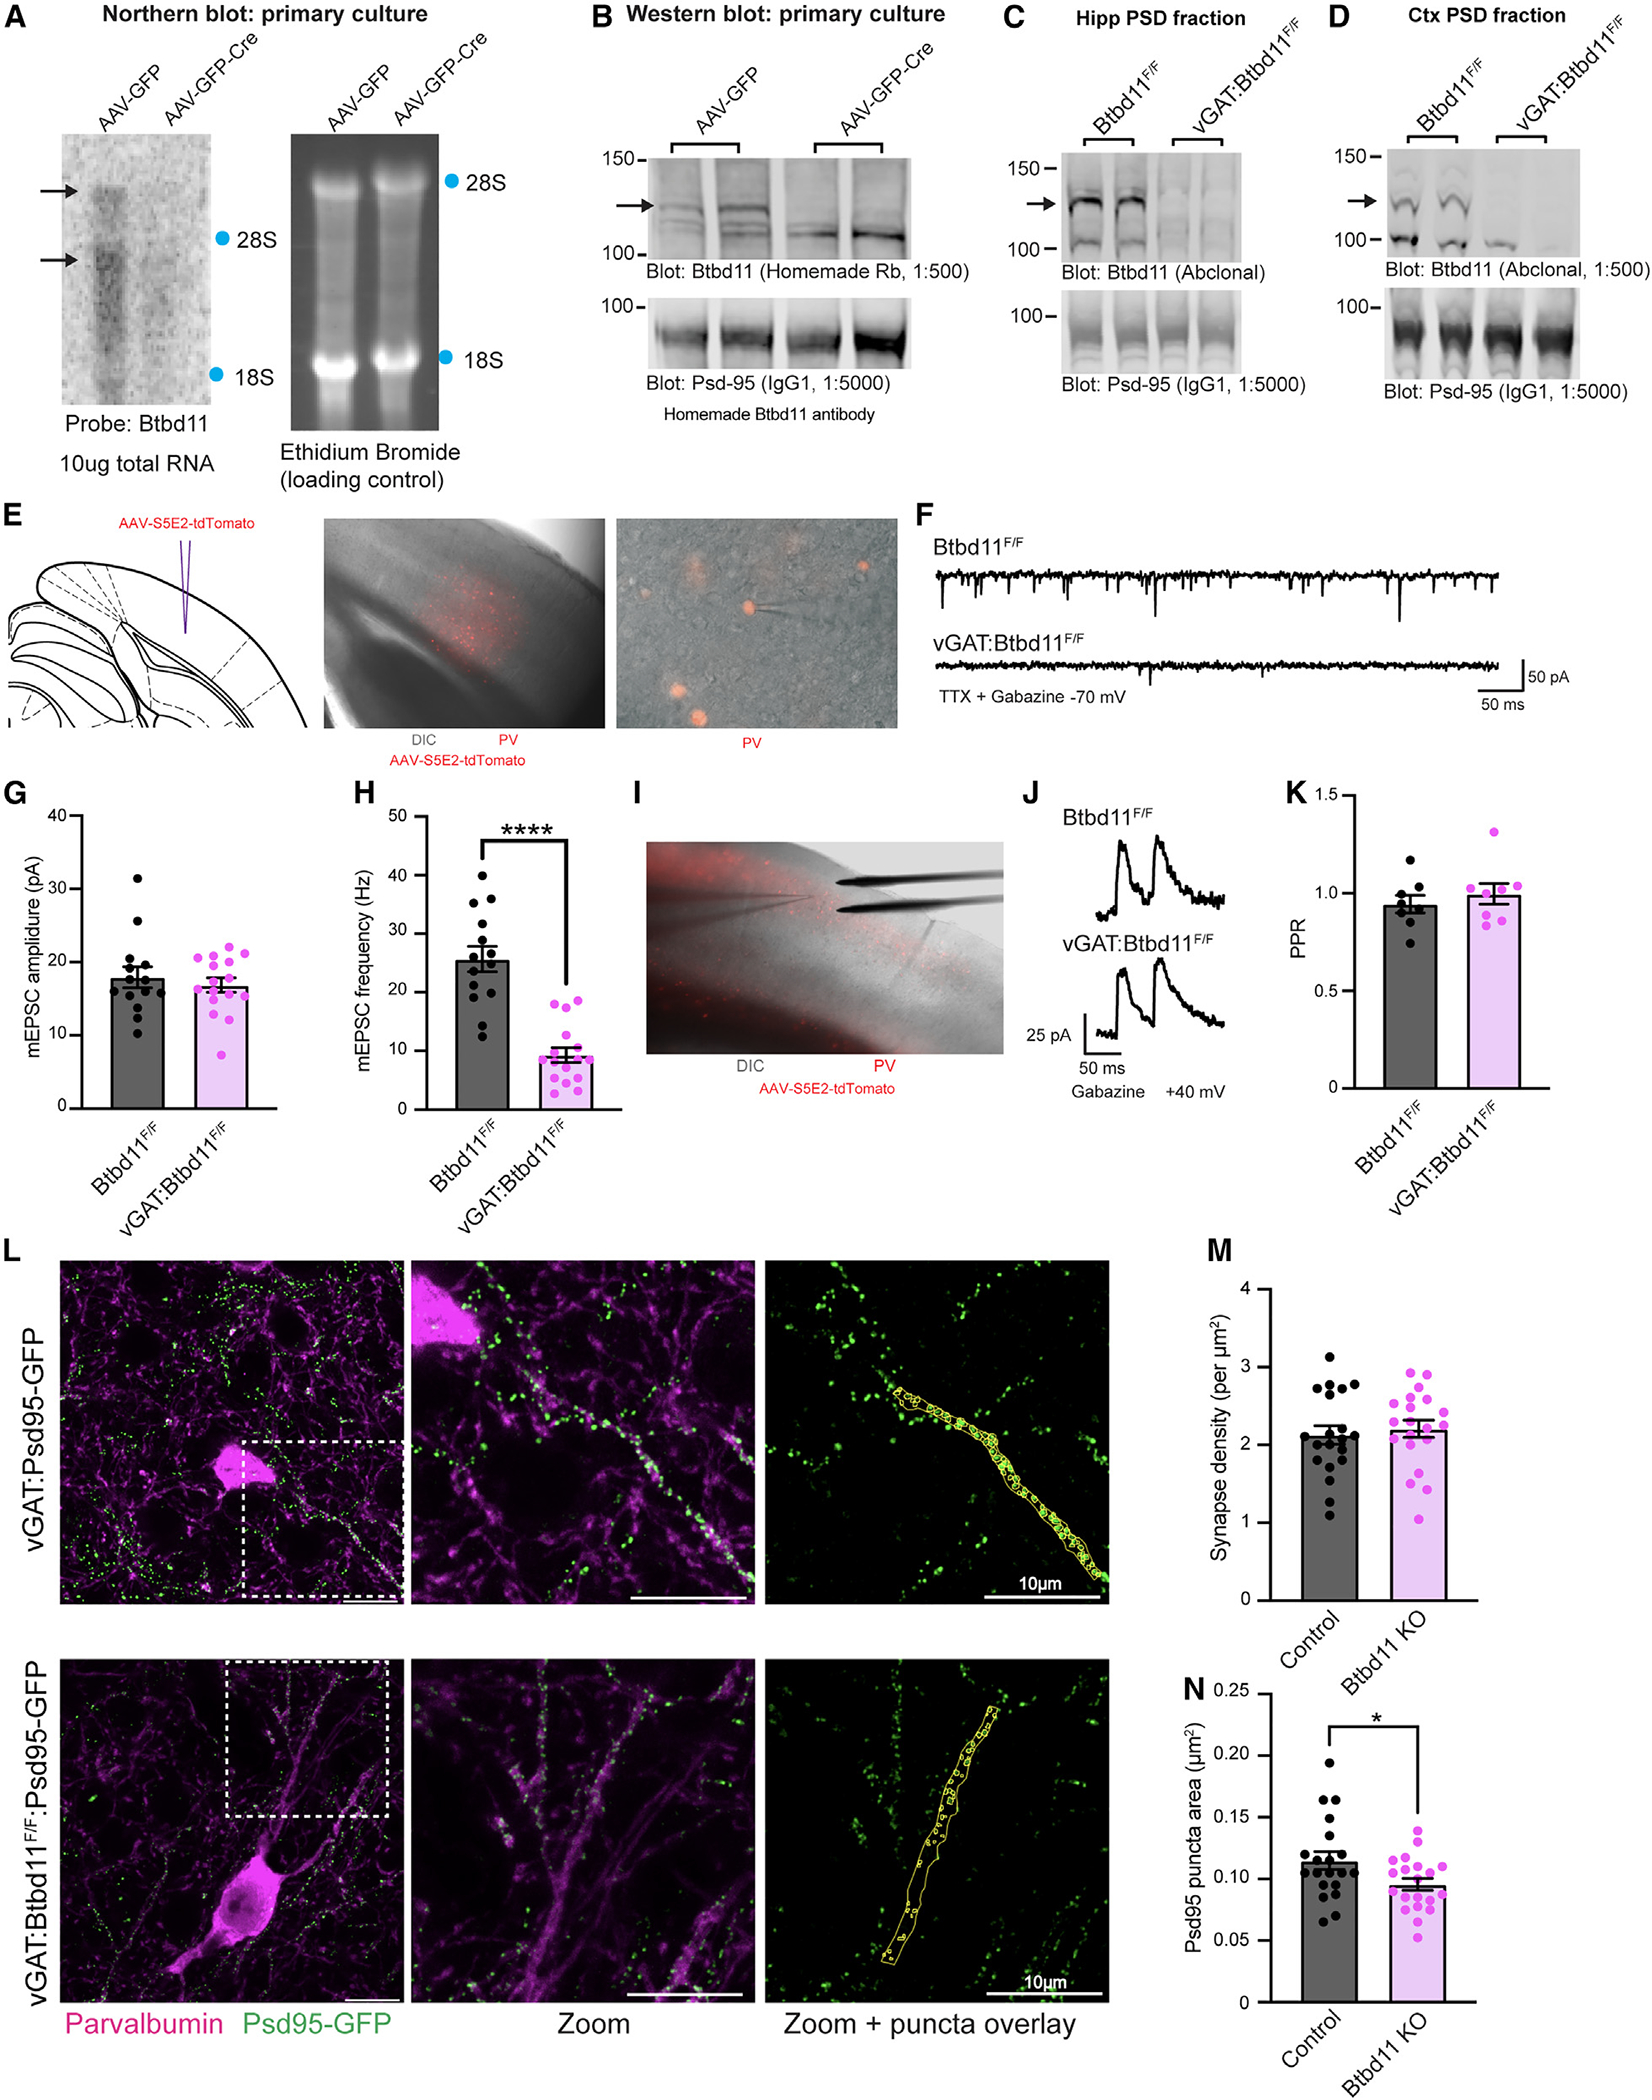
Figure 5. Btbd11 KO reduces glutamatergic signaling in PV-INs.

(A) Northern blot to evaluate levels of Btbd11 mRNA in Btbd11F/F cultures transduced with AAV-GFP (left lane) or AAV-GFP-Cre (right lane) and harvested at DIV14. 10 μg RNA was loaded onto a gel, and ethidium bromide staining was used to confirm equal loading of RNA. Locations of 18S and 28S ribosomal RNA are indicated with blue dots.
(B) Western blots characterizing the levels of Btbd11 (homemade antibody, top blot) and Psd-95 (bottom blot, as a loading control) in primary cortical Btbd11F/F cultures transduced with AAV-GFP (left lanes) or AAV-GFP-Cre (right lanes). 12 μg protein was loaded from the PSD fraction. Cells harvested at DIV12 and DIV14 (one sample per condition per time point). A black arrow indicates the band corresponding to Btbd11.
(C and D) Western blots evaluating the levels of Btbd11 (Abclonal antibody, top blot) and Psd-95 (bottom blot, as a loading control) from the (C) hippocampal and (D) cortical PSD fractions of female Btbd11F/F or vGAT:Btbd11F/F mice aged 3 months. 20 μg protein was loaded. Note the hippocampal PSD material was not generated with a sucrose gradient and so serves as a proxy for the PSD fraction. A black arrow indicates the band corresponding to Btbd11.
(E) Schematic depicting the site of AAV-S5E2-tdTomato injection, used to visualize PV-INs in the V1 (left), with zoomed-out (middle) and zoomed-in (right) merged images of differential interference contrast (DIC) and mCherry fluorescence.
(F) Example mEPSC traces recorded from V1 PV-INs in Btbd11F/F or vGAT:Btbd11F/F mice recorded at −70 mV in the presence of TTX and gabazine.
(G and H) The mEPSC amplitude and frequency, respectively, of mEPSCs recorded from PV-INs from Btbd11F/F (black) animals or vGAT:Btbd11F/F (magenta) mice. ****p < 0.0001.
(I) DIC image showing the placement of the electrical stimulating electrode for recordings in the V1.
(J) Example traces used to calculate the PPR in Btbd11F/F or vGAT:Btbd11F/F mice with cells held at +40 mV (to allow for the AMPA/NMDA ratio to also be calculated; see Figure S5G).
(K) Summary PPR data recorded from PV-INs from Btbd11F/F (black) or vGAT:Btbd11F/F (magenta) mice.
(L) Representative confocal images (maximum intensity projections) from the V1 of vGAT:Psd-95-GFP (control) or vGAT:Btbd11F/F:Psd-95-GFP (Btbd11 KO) slices. Endogenous Psd-95-GFP (green) shows putative glutamatergic synapses and is visualized alongside PV detected with immunohistochemistry (magenta). Psd-95-GFP puncta in PV neuron dendrites were manually identified (yellow regions of interest [ROIs], right panel). Scale bar: 10 μm.
(M) Glutamatergic synapse density, calculated by the density of Psd-95-GFP puncta, in PV-INs in control and Btbd11 KO animals.
(N) Median Psd-95-GFP puncta area per dendritic region in PV-INs of control and Btbd11 KO animals. *p < 0.05. Bars display the mean and error bars show S.E.M. For further details, see Figure S5.
