
Figure 6. Loss of Btbd11 impacts circuit function in vitro and in vivo.
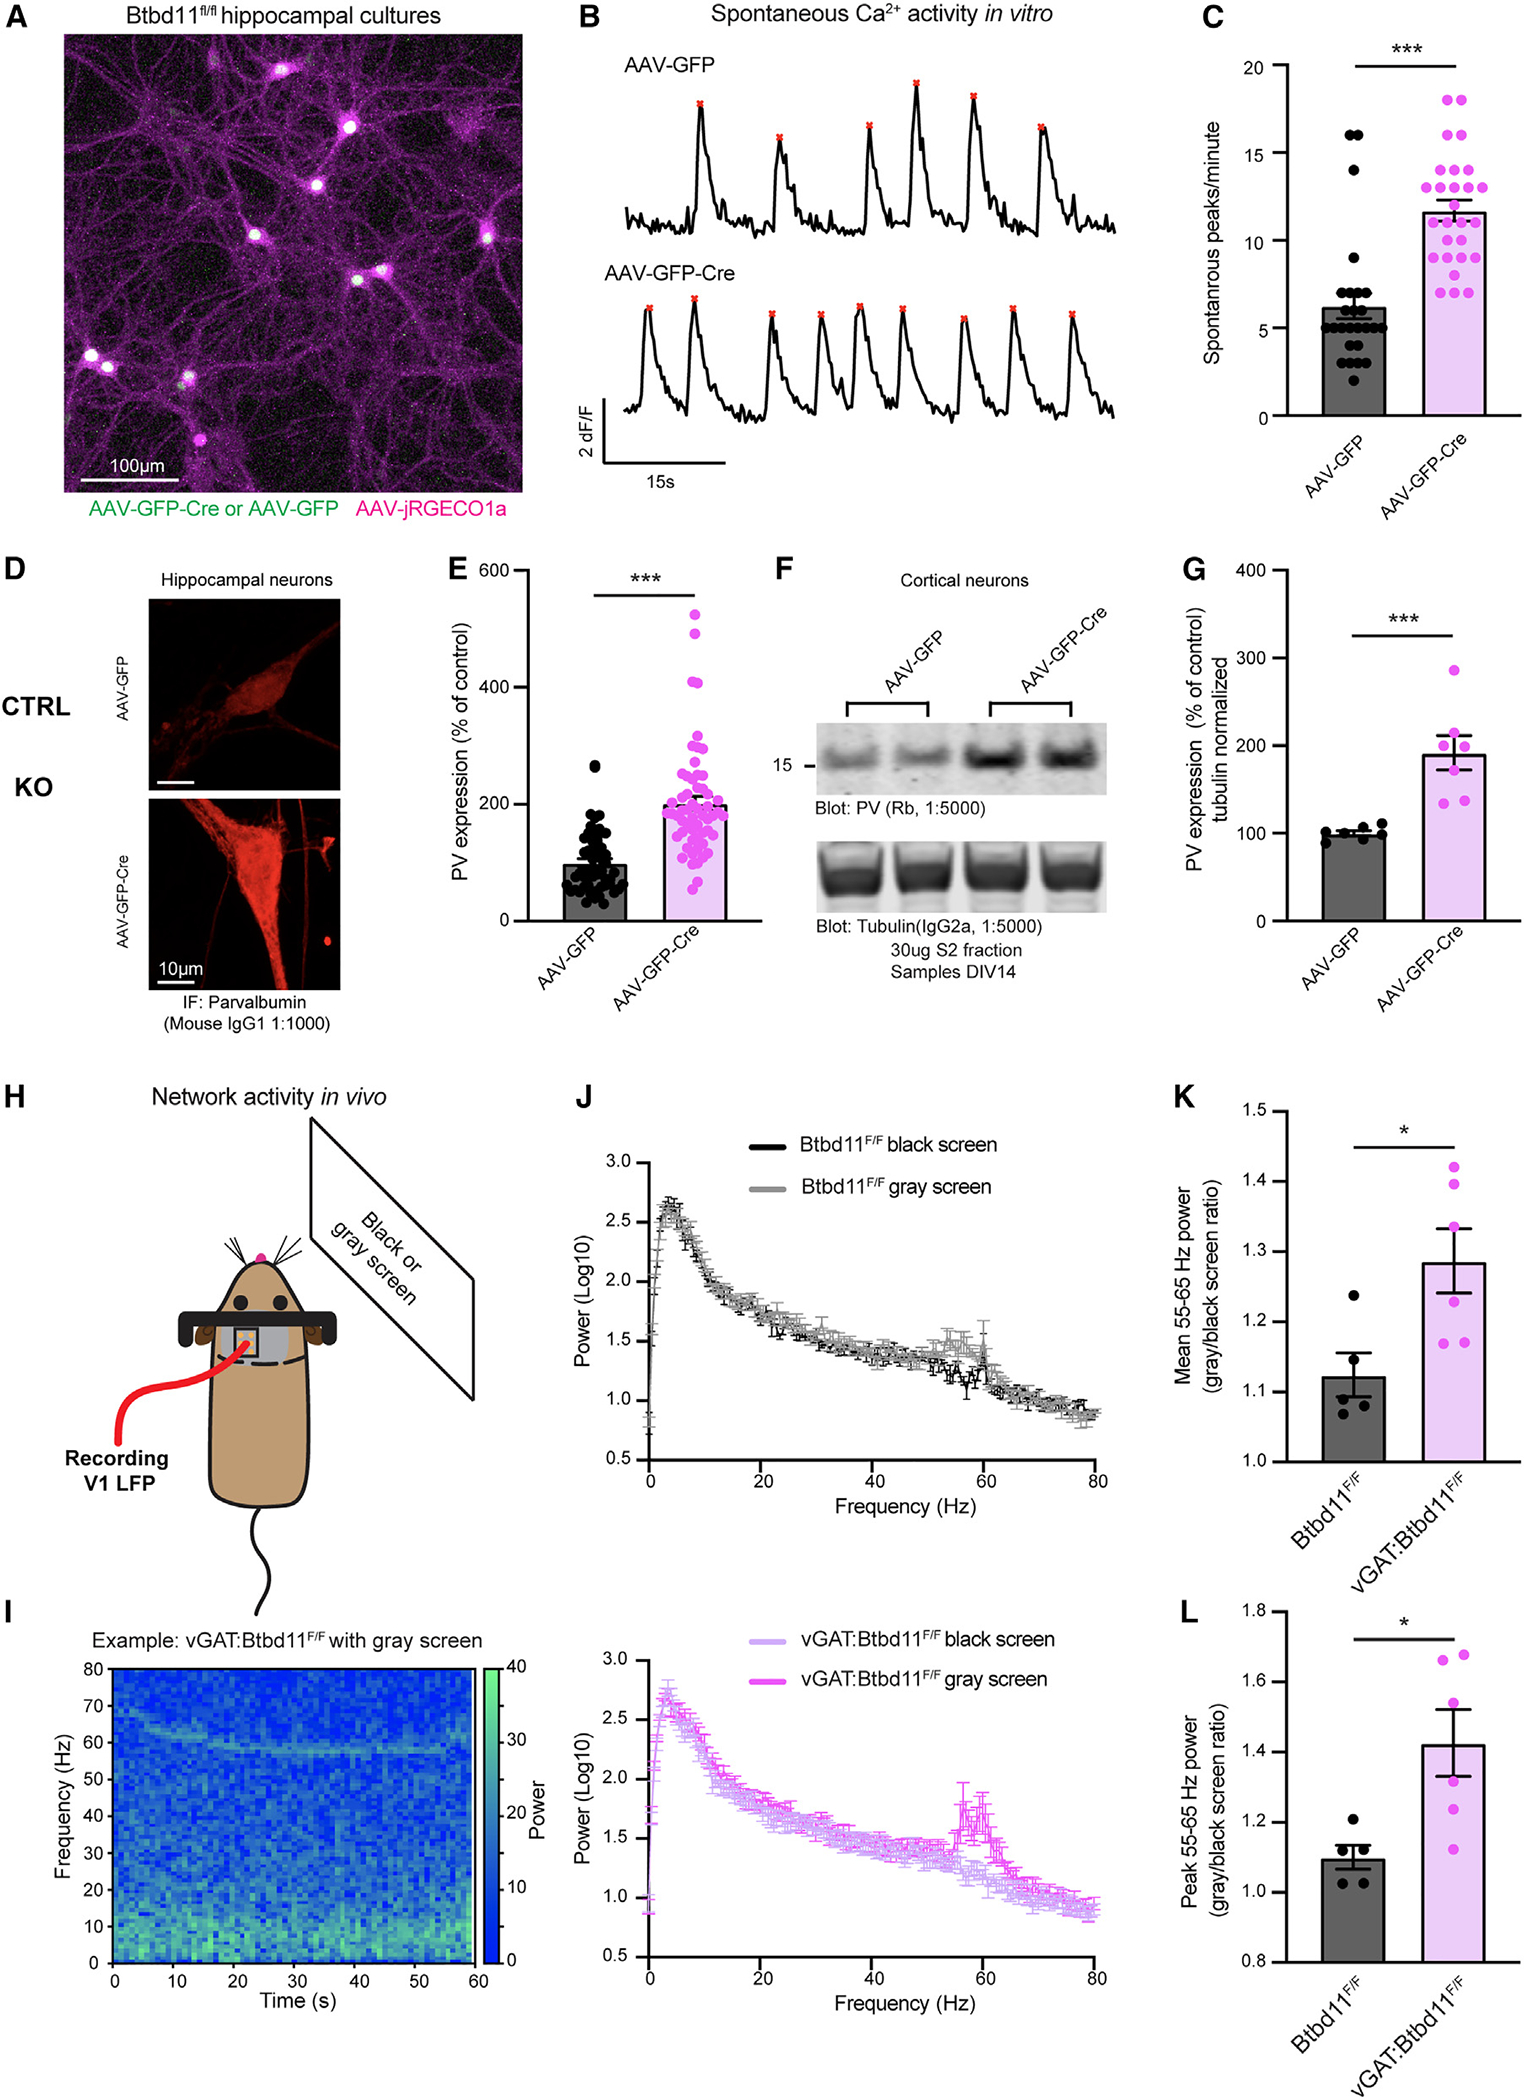
(A) Confocal live-cell imaging of primary cultured hippocampal neurons from Btbd11F/F mice transduced with AAV-jRGECO1a (magenta) and AAV-GFP or AAV-GFP-Cre (green). The example image is with AAV-GFP-Cre. Scale bar: 100 μm.
(B) Example traces for control (AAV-GFP, top) and KO (AAV-GFP-Cre, bottom) cultures showing the average Ca2+ activity across multiple neurons in one field of view over a 60 s period. Red stars indicate automatically identified peaks.
(C) Quantification of large Ca2+ transients across multiple ROIs and coverslips from 3 independent batches of neurons. Control (AAV-GFP) data are shown in black and KO (AAV-GFP-Cre) data in magenta. ***p < 0.001.
(D) Confocal image showing immunofluorescence of PV in DIV14 primary culture hippocampal Btbd11F/F neurons transduced with AAV-GFP (control, top) or AAV-GFP-Cre (KO, bottom). Scale bar: 10 μm.
(E) Quantification of PV immunofluorescence data with control data in black and KO data in magenta.
(F) Western blot from the cytosolic S2 fraction of DIV14 primary cultured cortical Btbd11F/F neurons transduced with AAV-GFP (control) or AAV-GFP-Cre (KO). Top blot shows levels of PV, and the bottom blot shows alpha-tubulin used as a loading control. 30 μg lysate was run.
(G) Quantification of western blot data evaluating levels of PV (normalized to alpha-tubulin levels) with control data in black and KO data in magenta.
(H) Schematic of in vivo setup used to assess narrowband gamma oscillations in the V1 with presentation of a gray screen.
(I) Example spectrogram showing the power over time in the 0–80 Hz range from the V1 of a vGAT:Btbd11F/F mouse presented with a gray screen.
(J) Power spectra for Btbd11F/F mice (n = 5, top; dark gray: dark screen, light gray: gray screen) and vGAT:Btbd11F/F mice (n = 6, bottom; light magenta: dark screen, dark magenta gray: gray screen).
(K and L) Quantification of the mean or peak 55–65 Hz activity, respectively, presented as a ratio of gray screen/black screen. *p < 0.05. Bars display mean, and error bars show SEM.