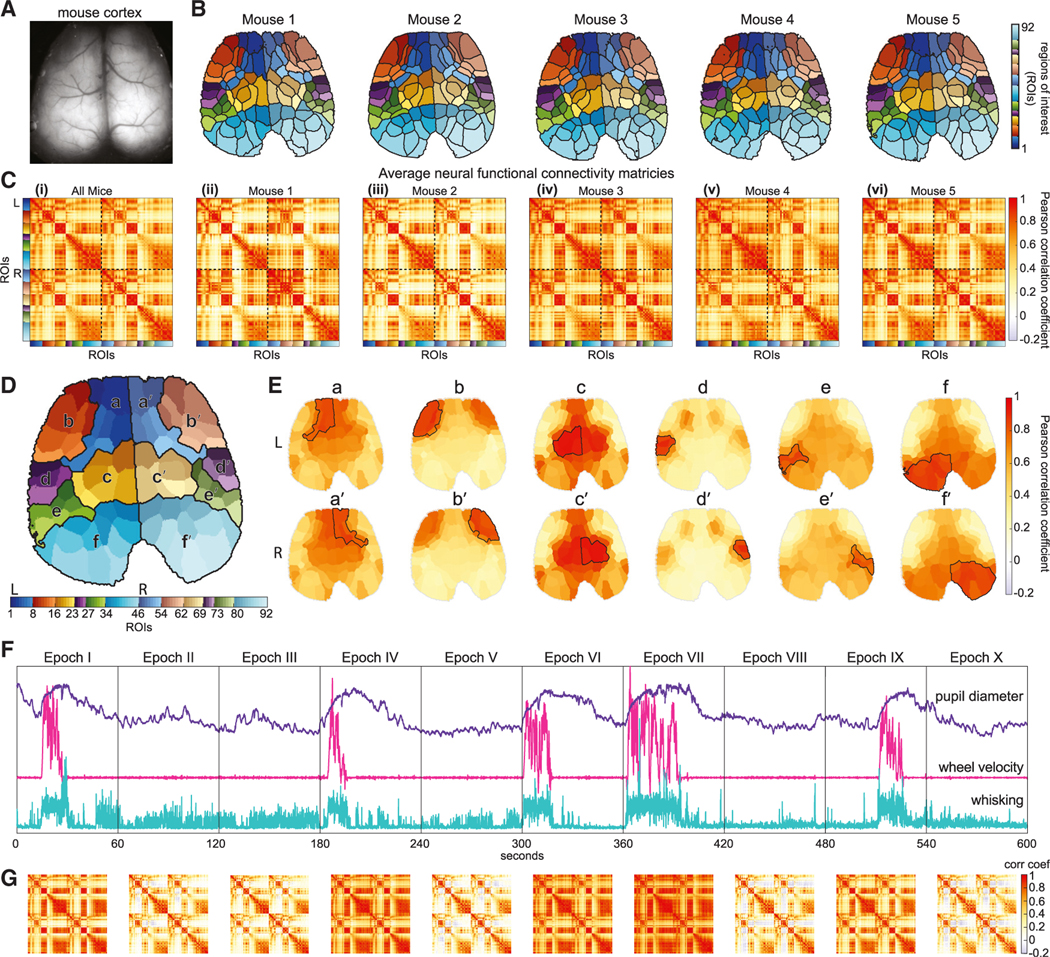
Figure 2. Functional topography of mouse cortex and long-epoch and dynamic neural correlation maps.

(A) Mouse cortex field of view.
(B) Functional topographic parcellations of the cortex into 92 bilaterally symmetric ROIs using spatiotemporal clustering of resting-state neural activity for each mouse.
(C) Long-epoch (10-min) correlation maps of neural activity from ROIs in (B) averaged across all recording sessions (i) over all mice (see Video S3) and (ii-vi) for each mouse.
(D) To simplify visualization, ROIs presented in (B) were grouped into six bilateral larger clusters based on the similarity of their average correlations (a and b, putatively frontal/motor; c-e, somatosensory; f, visual).
(E) Simplified cortical representations of the average long-epoch correlation map, with a-f and a′-f′ showing the mean of correlation values between each subgroup in (D) and all ROIs.
(F and G) (F) Behavioral signals for a 10-min acquisition session with (G) showing corresponding time-varying correlation maps for each 1-min epoch I-X. See also Figure S3 and Videos S2, S3, and S4.
