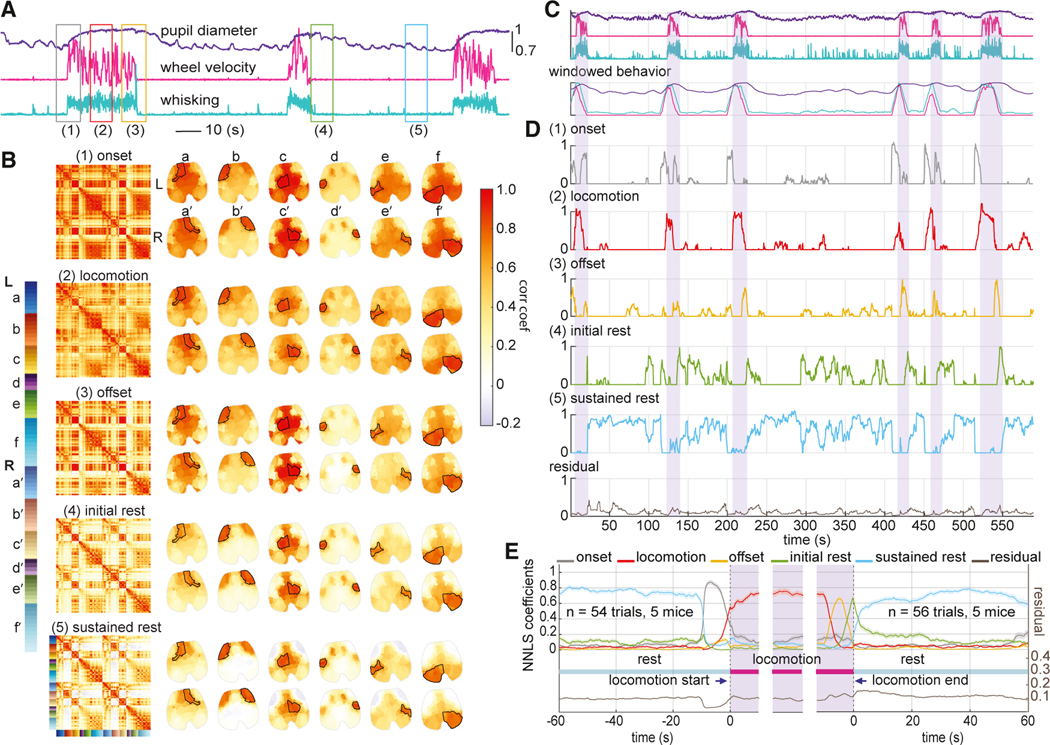
Figure 3. Neural correlation-based linear model of behavioral state.
(A) Plots of real-time behavioral time courses showing 3 locomotion bouts. Colored boxes (1–5) indicate epochs selected to represent (1) locomotion onset, (2) locomotion, (3) locomotion offset, (4) initial rest, and (5) sustained rest.
(B) Average 10-s window neural correlation maps and cortical representations for each behavioral state defined in (A) for one example mouse. Brain maps represent the average correlation between each ROI and the outlined areas labeled as a-f and a′-f′. See also Video S3.
(C) Mouse behavior for one example recording session, also plotted below smoothed with a 10-s window.
(D) Corresponding non-negative least-squares (NNLS) coefficients for a fit to each 10-s moving-window correlation map using the behavioral state correlation maps in (B) as a basis set. Bottom plot shows fit residual (see STAR Methods). Shaded bars indicate locomotion bouts.
(E) Average NNLS coefficients aligned over multiple locomotion events for five mice (n = 54 [onset], 47 [locomotion], and 56 [offset] epochs). Solid lines show average, while shaded bounds show standard errors (mean ± SEM). See also Figures S4 and S5 and Video S3.

