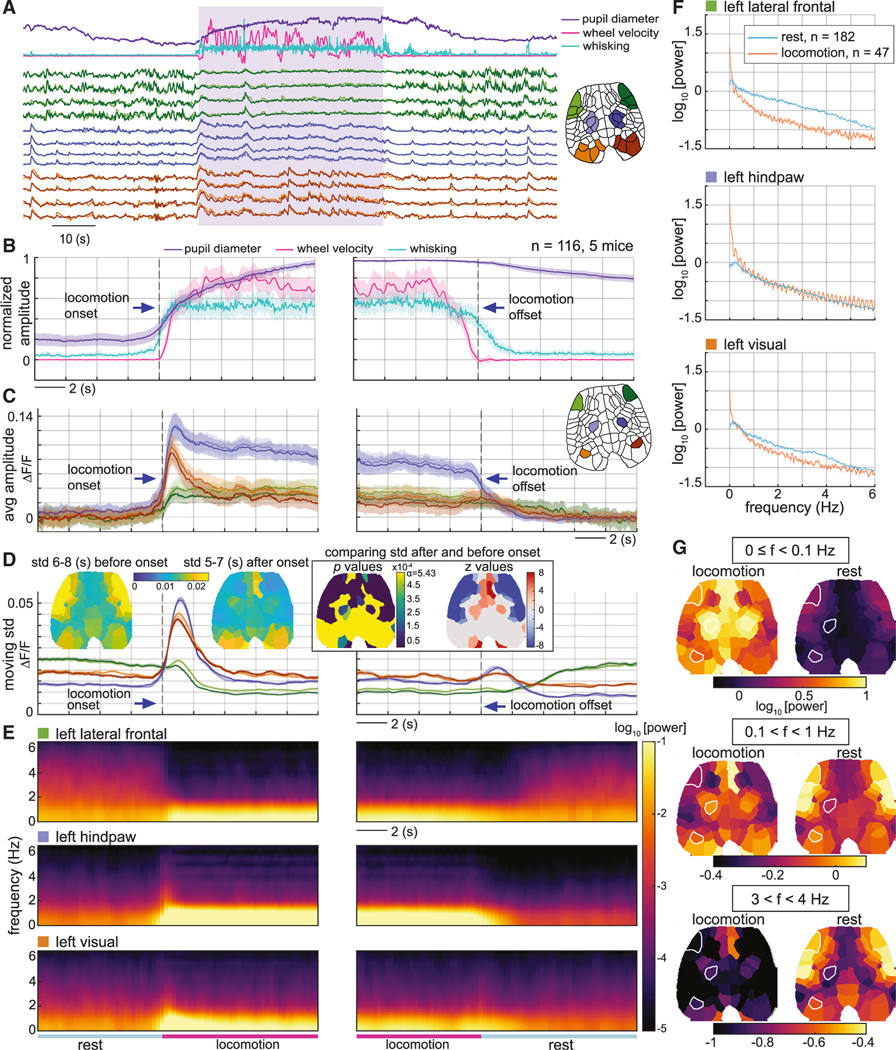
Figure 5. Dynamic properties of raw neural data during rest and locomotion transitions.
(A) Time courses of real-time behavior (top) and neural activity within the anterior lateral frontal cortex (green), hindpaw regions (blue), and visual cortex (red) for one example epoch. The locomotion period is indicated by the shaded area.
(B-E) Averages across repeated locomotion bouts for (B) behavioral signals, (C) neural activity, (D) standard deviations (SDs) of neural activity overtime for prior 2-stemporal window, and (E) spectrogram of neural activity. Time courses were aligned around locomotion onset (left) and locomotion offset (right) (n = 116, five mice, mean ± SEM). Inset brain maps on (D) depict the SD of neural activity 6–8 s before and 5–7 s after locomotion onset, and the p values and z values of the comparison between the SDs (Wilcoxon rank-sum test, p < 0.05, Bonferroni corrected). Z scores set to zero for statistically insignificant comparisons. Note that sensory hindpaw and visual regions show a substantial increase in averaged moving-window SD during locomotion onset simply because signals are rapidly increasing on a single trial level.
(F) Comparison of power spectra (mean ± SEM) of neural activity during locomotion (20 s in the middle of locomotion n = 47, 5 mice) and rest (30–50 s after locomotion, n = 182, five mice) for same 3 ROIs shown in (C).
(G) Brain maps of the average spectral power for three different frequency bands comparing locomotion (left) with rest (right).

