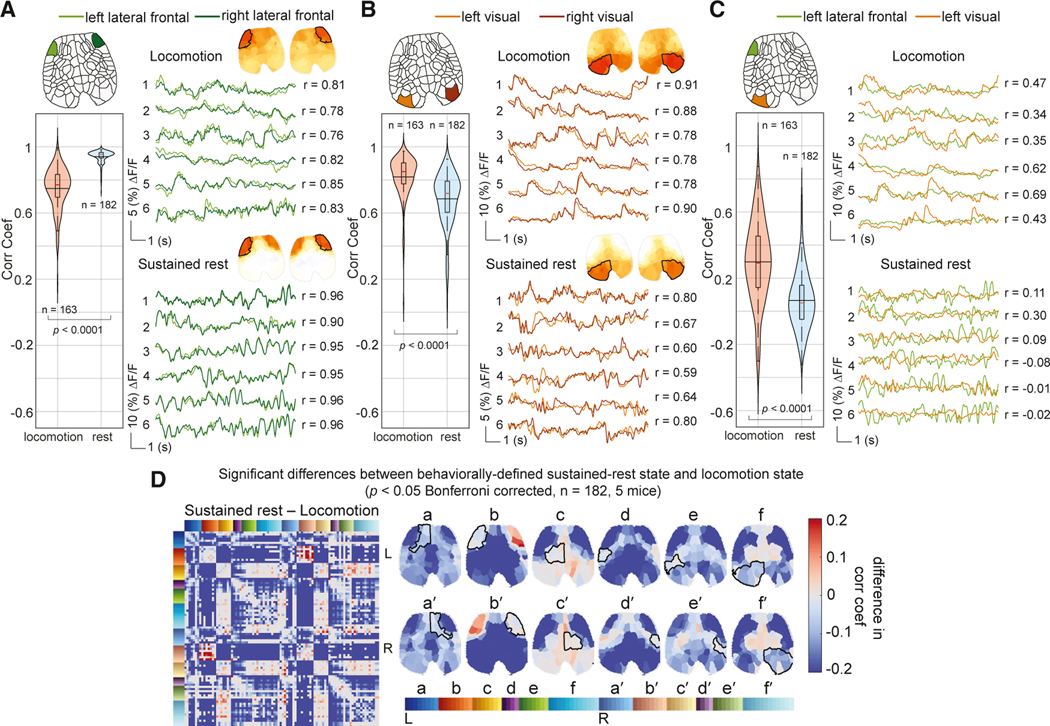
Figure 6. Comparing neural correlation shifts between locomotion and rest for different brain regions.
(A-C) Time series extracted from the ROIs indicated for six different epochs during locomotion (top) and sustained rest (below). (A) Bilateral correlation between anterior lateral frontal regions is significantly higher during rest. (B) Bilateral correlation between visual regions is significantly decreased during rest. (C) Anterior-posterior correlation is significantly decreased during rest. Across five mice, 163 locomotion and 182 resting bouts were compared (Wilcoxon rank-sum test, p < 0.05).
(D) Differences in correlation maps between sustained rest and locomotion. Only statistically significant differences are displayed (Wilcoxon rank-sum test, p < 0.05, Bonferroni corrected, n = 182, five mice).

