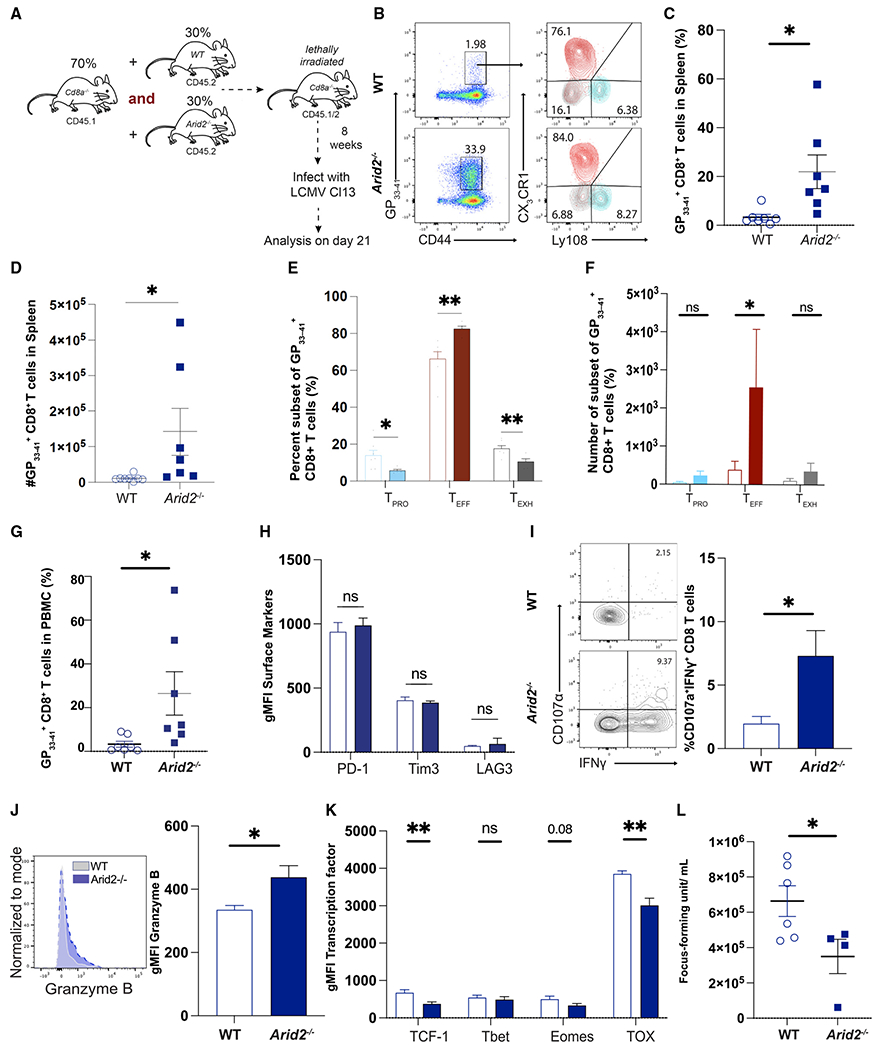
Figure 1. PBAF restricts expansion and promotes exhaustion of LCMV-specific CD8+ cells.

(A) Mixed bone marrow (MBM) chimeric mice reconstituted with CD45.1 CD8α−/− and wild-type CD45.2 or Arid2−/− CD45.2 were infected with LCMV clone 13 (Cl13) and analyzed on day 21 p.i.
(B) Representative flow plots showing the frequency of GP33+ splenic CD8+ T cells in MBM chimera mice.
(C–G) Summary data showing the proportion, subset distribution, and total number of GP33+ splenic CD8+ T cells in MBM chimera mice.
(H) Summary data displaying the per cell expression (geometric mean fluorescence intensity [gMFI]) of PD-1, LAG3, and TIM3 in GP33+ splenic CD8+ T cells.
(I) Representative flow plots and summary data showing the proportion of IFN-γ+CD8+ T cells.
(J) Representative flow plots and summary data showing gMFI of granzyme B in GP33+ splenic CD8+ T cells.
(K) Summary data showing the gMFI of TCF1, T-bet, Eomes, and TOX in GP33+ splenic CD8+ T cells.
(L) Scatterplot displaying viral load in the sera.
Summary data (mean ± SEM) are pooled from 2 experiments with at least 3 mice/group/experiment. Data are representative of two independent experiments. *p < 0.05, **p < 0.01, ***p < 0.0001.
