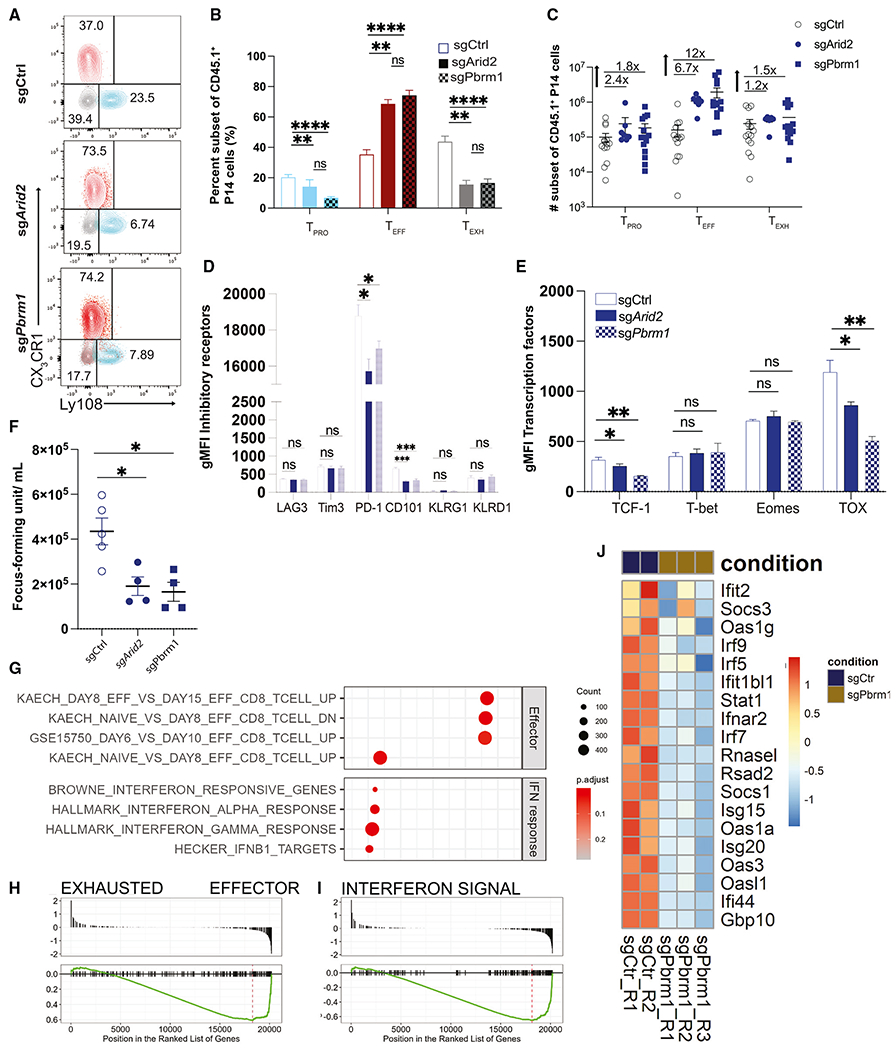
Figure 3. PBAF promotes the transition of TPRO to TEXH by regulating IFN-I response.

(A) Representative flow plots and summary data showing the frequency of the three subsets of control and Arid2- or Pbrm1-deleted CD45.1+CD8+ T cells 21 days p.i.
(B and C) Representative and summary plot displaying the frequency and numbers of the three subsets within control or Arid2 and Pbrm1 guide RNA (gRNA) transduced P14 CD8+ T cells.
(D and E) Summary data showing gMFI of LAG3, Tim3, PD-1, 2B4, KLRD1, KLRG1, TIGIT, TCF1, Tbet, Eomes, and TOX in CD45.1+ CD8 T cells.
(F) Plot displaying viral load in the sera from experimental mice reciving control or Arid2- or Pbrm1-deleted T cells.
(G) Bulk RNA-seq GSEA results showing pathways significantly up- or downregulated in Pbrm1-deficient P14 T cells during LCMV Cl13 infection.
(H and I) Enrichment plots showing representative gene sets identified in the GSEA of Pbrm1-deficient P14 T cells.
(J) Heatmap of IFN pathway-related genes with differential expression between control and Pbrm1-deficient conditions.
Summary data (mean ± SEM) are pooled from at least 2 independent experiments with at least 4 mice/group per experiment. (F) is from one independent experiment with at least 4 mice/group. Data are representative of three independent experiments. (G–J) Four replicates were included in each condition. *p < 0.05, **p < 0.01, ***p < 0.0001.
