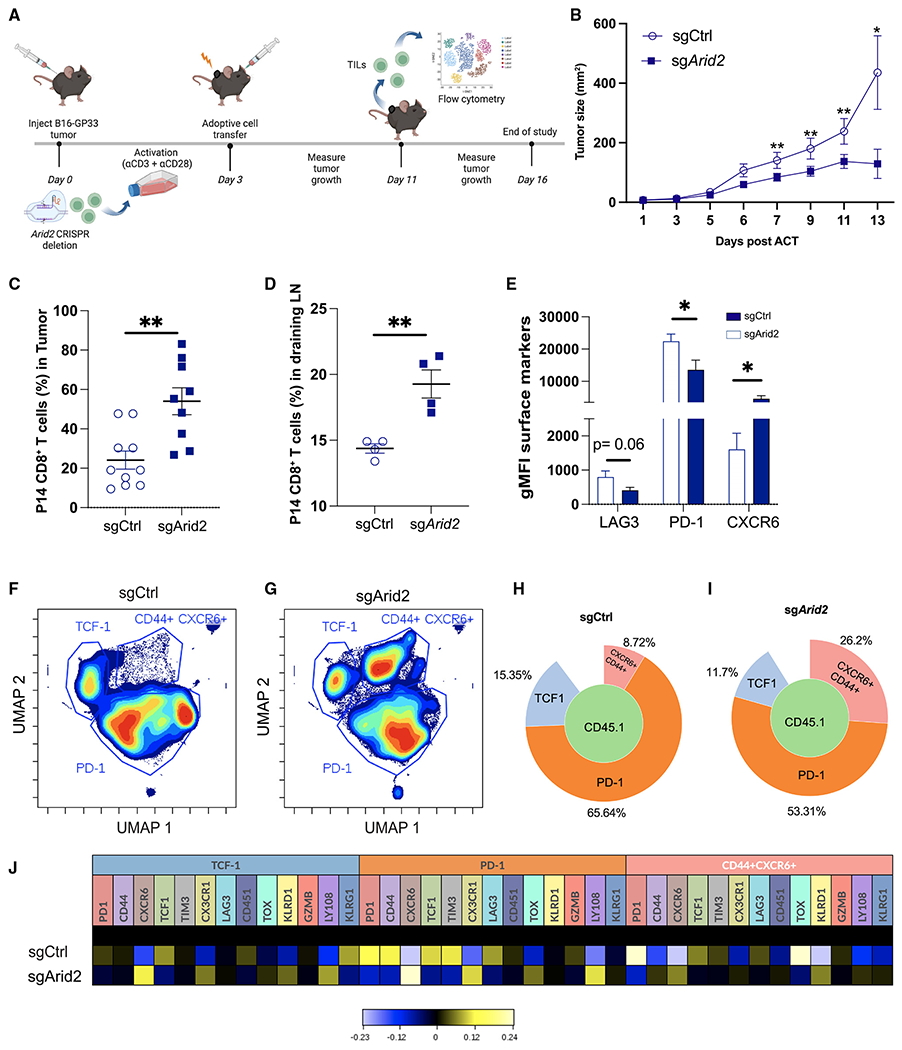
Figure 7. Loss of PBAF promotes expansion and limits T cell exhaustion to control tumor.

(A) Experimental design.
(B) Tumor growth curves; of note, summary data are from (n = 9) sgCtrl transduced cell recipients and (n = 13) sgArid2 transduced cell recipients. sgCtrl transduced cell recipient mice that did not developed >10% of tumor volume (n = 1) were excluded from the analysis.
(C and D) Summary plot showing the frequency of CD45.1+ CD8+ T cells in the tumor and draining lymph node at day 8 post-ACT.
(E) FlowJo analysis showing summary data showing the per-cell expression (gMFI) of LAG3, PD1, and CXCR6 in CD45.1+ CD8+ T cells.
(F-J) The phenotype of CD45.1+ CD8+ T cells in the tumor was assessed by high-dimensional spectral flow cytometry on 12 markers using Cytobank (STAR Methods).
(F and G) Unbiased UMAP displaying clusters identified four clusters following concatenation of CD45.1+ CD8 T cells: (n = 6) sgCtrl transduced cells and (n = 6) sgArid2 transduced cells.
(H and I) Frequency of the three populations displayed using Population Sunburst.
(J) Heatmap showing the mean expression of each marker in gated population.
Data (mean ± SEM) in (C) and (E) are pooled and are from at least 3 mice/group/experiment and are representative of at least 3 independent experiments. (D) is from one independent experiment with 4 mice/group. Heatmaps were generated using hyperbolic arcsine (arcsinh) transformation against the mean expression of the combined concatenated samples. *p < 0.05, **p < 0.01, ***p < 0.0001.
