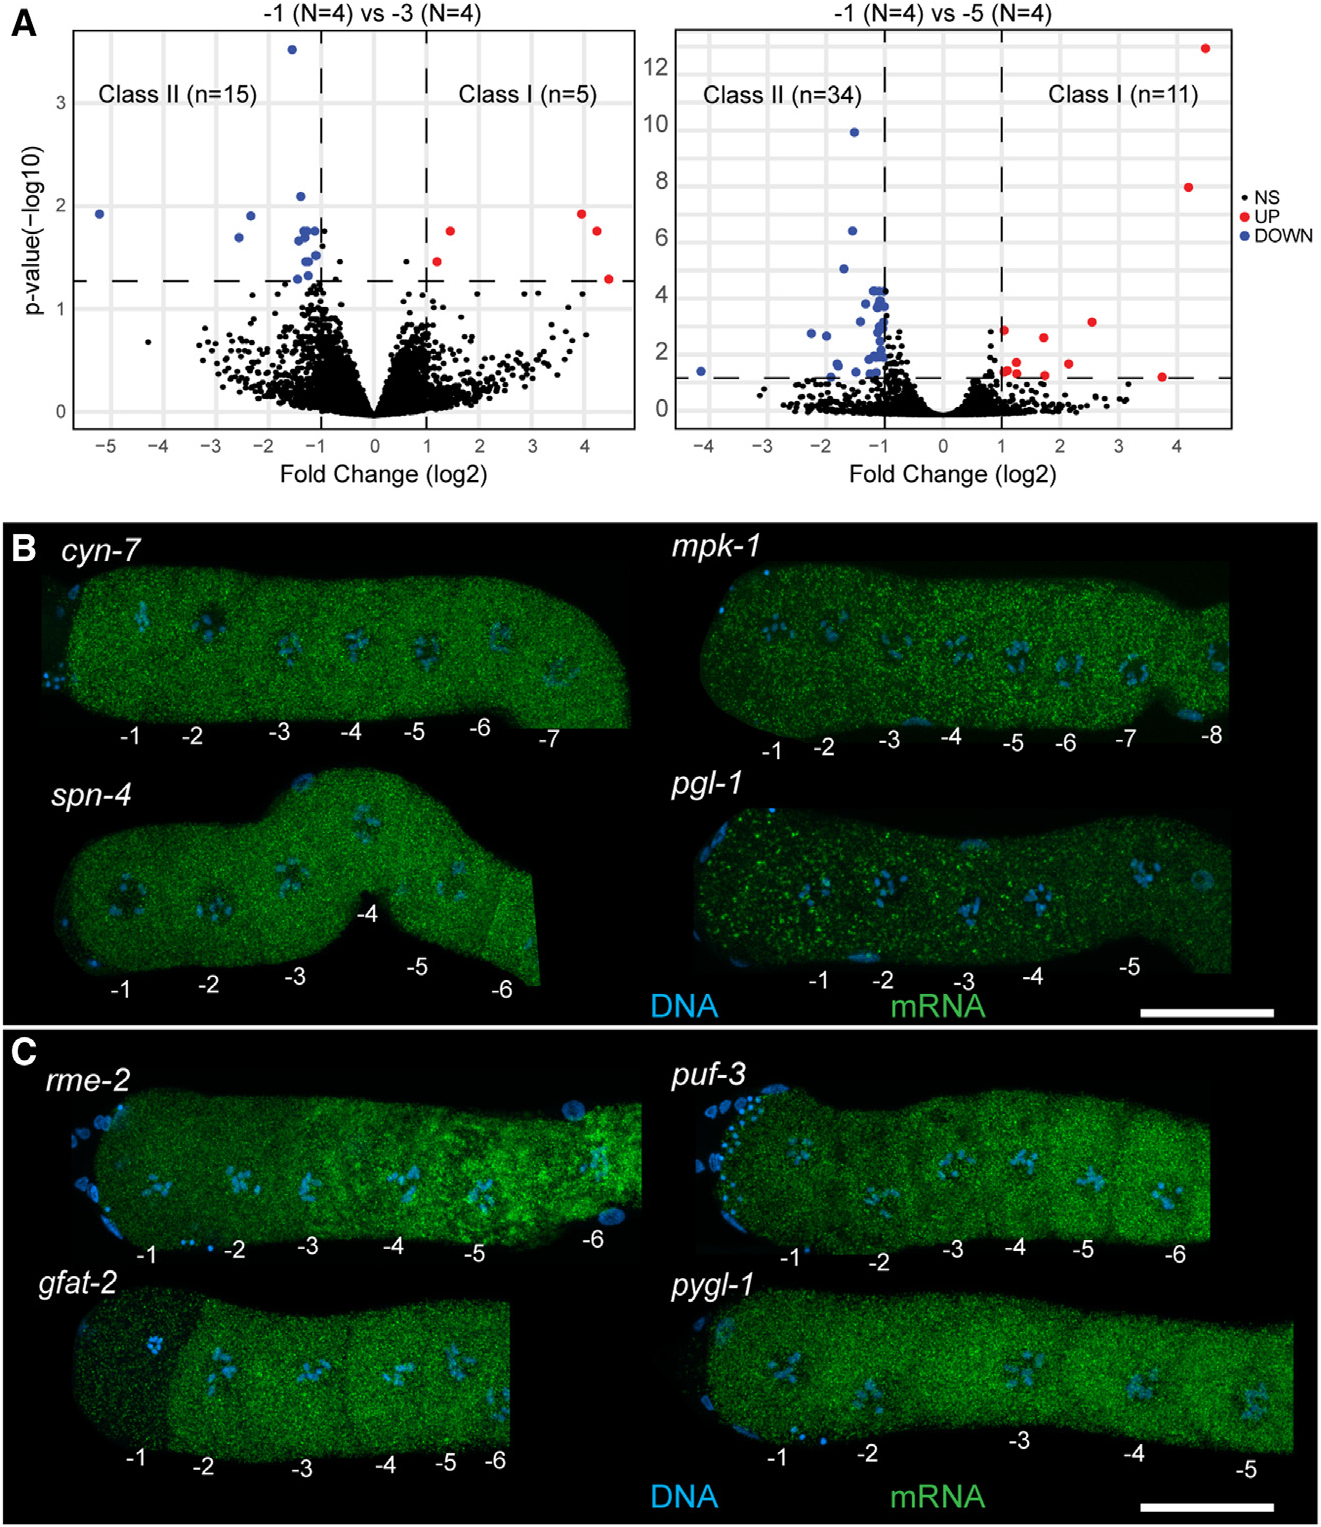
Figure 2. Differential accumulation of maternal transcripts in arrested oocytes as they age.

(A) DESeq2 analysis of −1 oocytes compared with −3 and −5 oocytes. Downregulated transcripts are in blue, upregulated transcripts are in red. Significance cutoff was set to 23 fold change (vertical dashed lines) and p < 0.05 (horizontal dashed line).
(B) Dissected and stained germlines showing representative expression patterns for cyn-7, mpk-1, spn-4, and pgl-1. Shown are maximum-intensity projection images through the full z stack with DNA (blue) and mRNA target (green).
(C) Dissected and stained germlines showing representative expression patterns for the class II transcripts rme-2, puf-3, gfat-2, and pygl-1. Shown are maximum-intensity projection images through the full z stack DNA (blue) and mRNA target (green). (B, C) Scale bars, 20 mm. See also Figures S3 and S4 and Tables S1 and S2.
