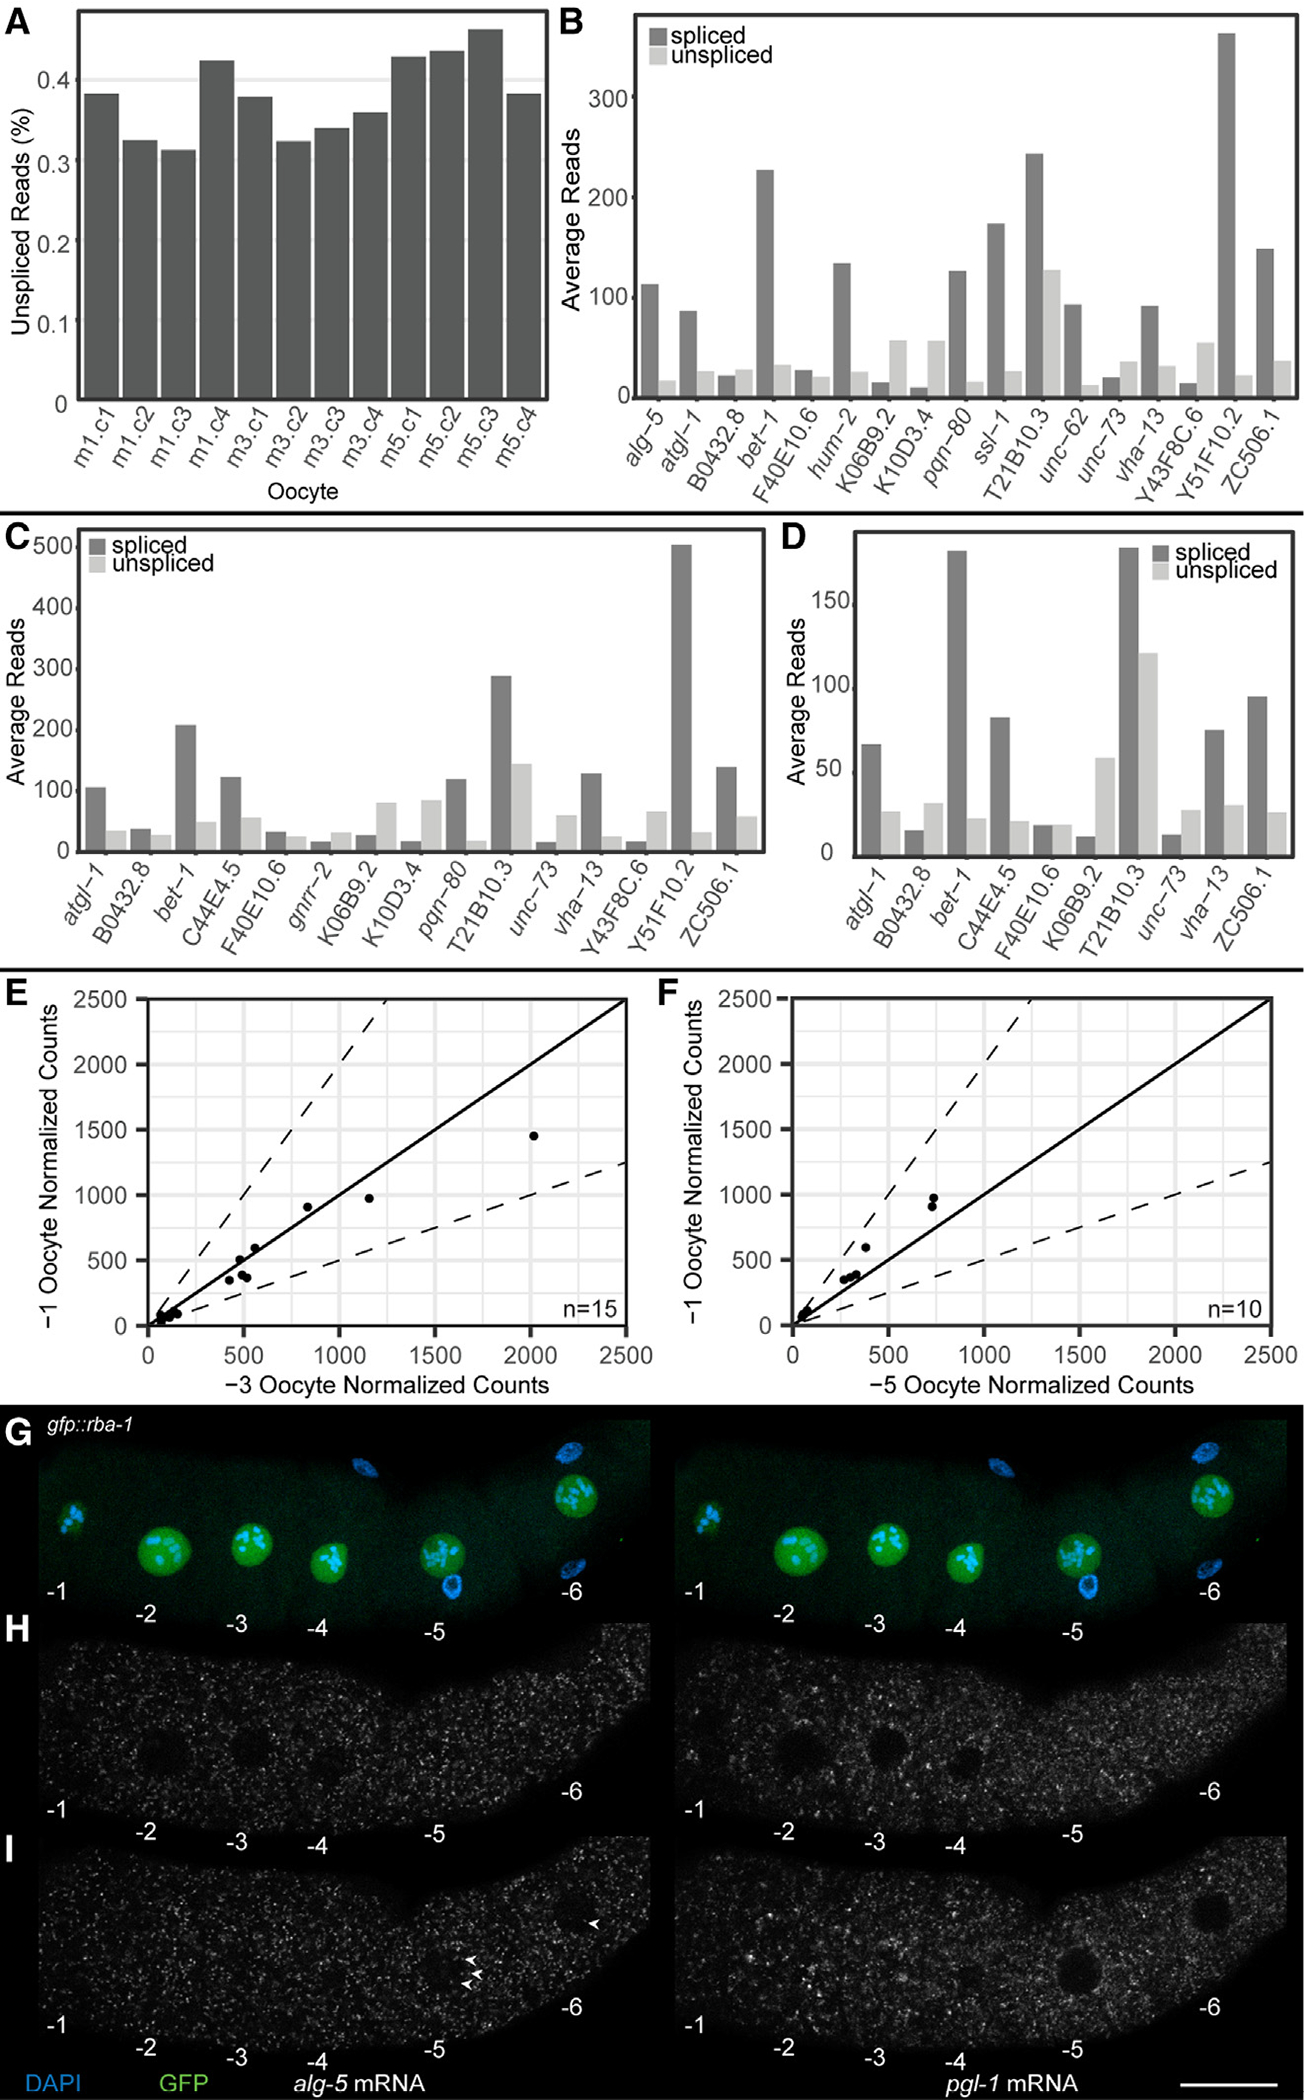
Figure 4. RNA velocity to assess nascent transcription in arrested meiosis I oocytes.

(A) Percentage intronic reads vs. total RNA reads. Oocyte positions are labeled m1 (−1 oocyte), m3 (−3 oocyte), and m5 (−5 oocyte).
(B–D) Intronic read count vs. exonic read count for genes detected as expressing intronic reads in (B) −1 oocyte, (C) −3 oocyte, and (D) −5 oocyte.
(E and F) Comparison of normalized exonic reads from DESeq2 of genes containing intronic reads in the −1 oocyte. Comparisons are between (E) the −1 and the −3 oocytes and (F) the −1 and the −5 oocytes. Dotted line depicts ±2-fold difference.
(G–I) Oocytes from a dissected gfp::rba-1 germline with DAPI (blue), GFP::RBA-1 (green), alg-5 mRNA (white, left side), and pgl-1 mRNA (white, right side). Oocytes are numbered decreasing from oldest to youngest. (G) Maximum-intensity projections of DAPI and GFP showing the positions and sizes of the oocyte nuclei. (H and I) Individual slices from a z stack of the dissected germline, one (H) at the medial plane of oocytes −1 through −4 and another (I) through the medial plane of oocytes −5 and −6. Nuclear alg-5 puncta are labeled (arrowheads). Scale bar, 20 μm. See also Figure S5 and Table S3.
