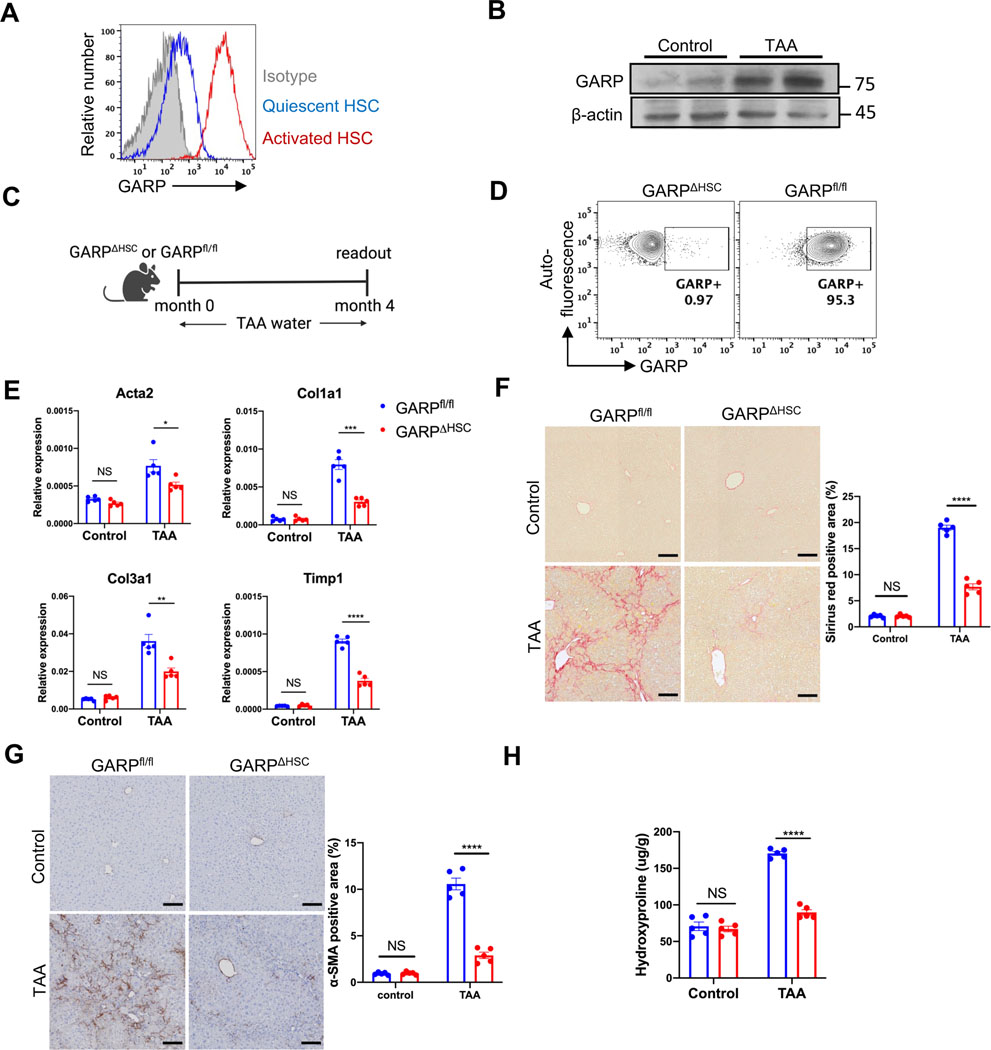
Fig. 1. GARP on HSCs exacerbates liver fibrosis.
(A) GARP expression on the surface of quiescent (1-day cultured) or activated (7-day cultured) HSCs detected by flow cytometry. (B) Immunoblot of GARP in liver lysates of mice fed with TAA for 4 months or control naïve mice. (C) Experimental design of TAA-induced liver fibrosis in GARPΔHSC mice and GARPfl/fl littermates. (D) Flow cytometry analysis of GARP expression on the surface of HSCs. HSCs were isolated from the liver of mice fed with TAA for 4 months and were gated on vitamin A-mediated autofluorescence. (E) Fibrotic gene expression in the liver of mice determined by qRT-PCR. (F) Representative images of Sirius red staining of mouse liver (left) and quantification of stained area (right). Scale bar 100 μm. (G) Representative images of IHC staining of α-SMA in the liver of mice (left) and quantification of stained area (right). Scale bar 100 μm. (H) Concentration of hydroxyproline in the liver of mice. Each data point represents one mouse. Data are presented as mean ± standard error of mean (SEM). Data are from one experiment representing at least three independent experiments with similar results. Unpaired t-test was used to compare two groups. *p<0.05;**p<0.01;***p<0.001;****p<0.0001; NS, not significant.

