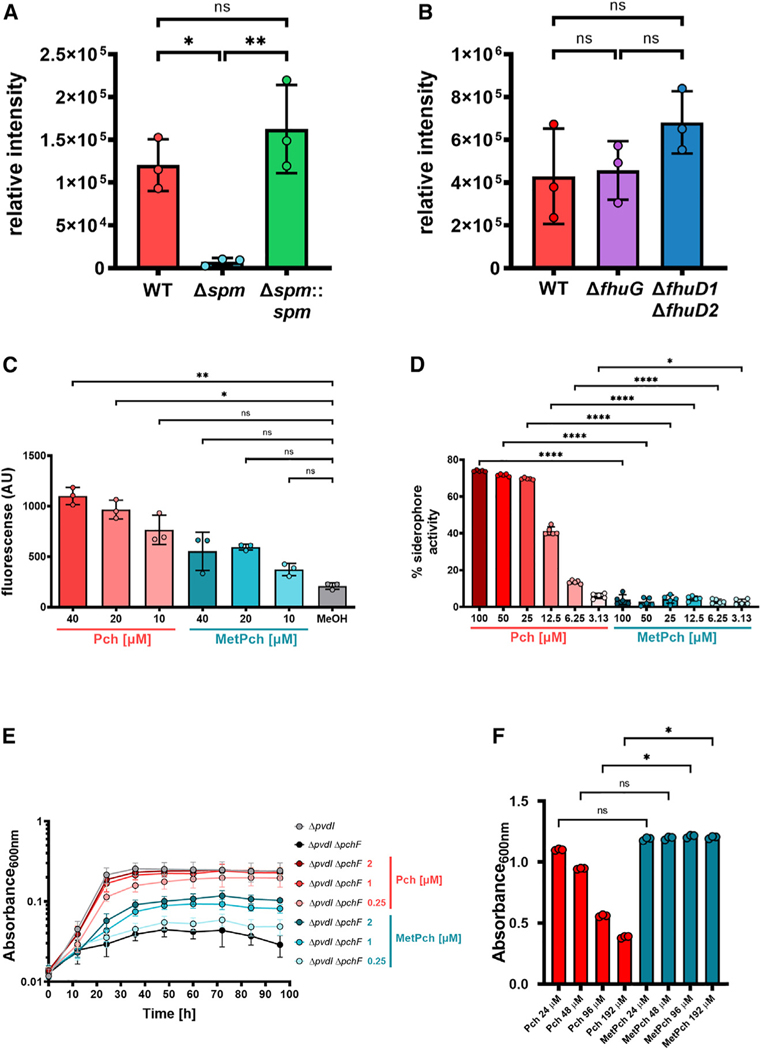
Figure 3. Spm-mediated methylation leads to Pch inactivation.
(A) Incubation of PAO1 ΔpqsA cell-free supernatant with overnight cultures of MRSA WT, an spm mutant strain (Δspm), and its corresponding complementation strain (Δspm::spm) results in high amounts of MetPch production by WT and Δspm::spm but not by Δspm. n = 3 biological replicates. One-way ANOVA with Tukey’s multiple comparison.
(B) The Fhu xenosiderophore uptake machinery does not promote MetPch production. Mutation of the two ferric-siderophore binding proteins fhuD1 and fhuD2 (ΔfhuD1 ΔfhuD2), as well as fhuG (ΔfhuG), which is essential for the uptake of several hydroxamate xenosiderophores, does not result in significantly lowered MetPch production. n = 3 biological replicates. One-way ANOVA with Tukey’s multiple comparison.
(C) Exposure to Pch, but not MetPch, results in significantly elevated ROS production in MRSA WT compared with the carrier control (MeOH). n = 3 biological replicates. Kruskal-Wallis with Dunn’s multiple comparison.
(D) Siderophore activity of Pch and MetPch was evaluated by liquid Chrome Azural S assay. Siderophore activity of MetPch is significantly reduced compared with Pch across all tested concentrations. n = 5 biological replicates. One-way ANOVA and Šidák’s multiple comparison.
(E) Pch, but not MetPch, supports P. aeruginosa growth under low iron conditions. Shown are 96 h growth curves of a PAO1 pyoverdine mutant (ΔpvdI) and a pyoverdine/Pch double mutant (ΔpvdI ΔpchF) supplemented with different concentrations of synthetic Pch or MetPch. To create a low iron environment, 500 µM 2,2′-bipyridine was added to the growth medium. n = 5 biological replicates from 4 independent experiments.
(F) Exposure to Pch, but not MetPch, results in growth inhibition of MRSA under low iron conditions (chelex-treated TSB). Growth was significantly reduced in samples treated with high concentrations of Pch (96 and 192 µM) compared with samples treated with equimolar amounts of MetPch. n = 3 biological replicates. Kruskal-Wallis with Dunn’s multiple comparison.
(A–F) Values are mean ± SDs. *p ≤ 0.05, **p ≤ 0.01, ***p ≤ 0.001, ****p ≤ 0.0001, ns, not significant.

