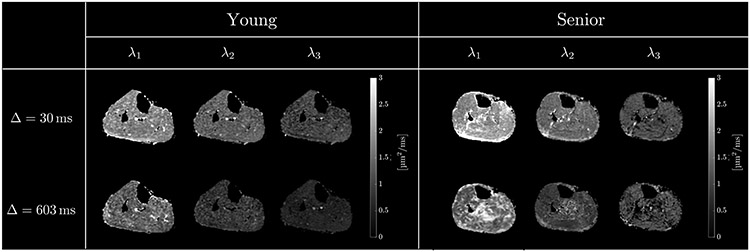
Figure 3:
Diffusion tensor eigenvalue images: λ1(t), λ2(t) and λ3(t) for two different values of the diffusion time, Δ = 30 ms, Δ = 603 ms, for a young (left) and an older (right) participant. Presence of unsuppressed fat is usually visible as intensity artifact bands of subcutaneous fat shifted in the phase encoding direction into the muscle regions. The absence of such bands at low and high mixing times, TM confirms the excellent fat suppression in the STEAM-DTI sequence. The decrease in SNR at longer diffusion can be clearly visualized.

