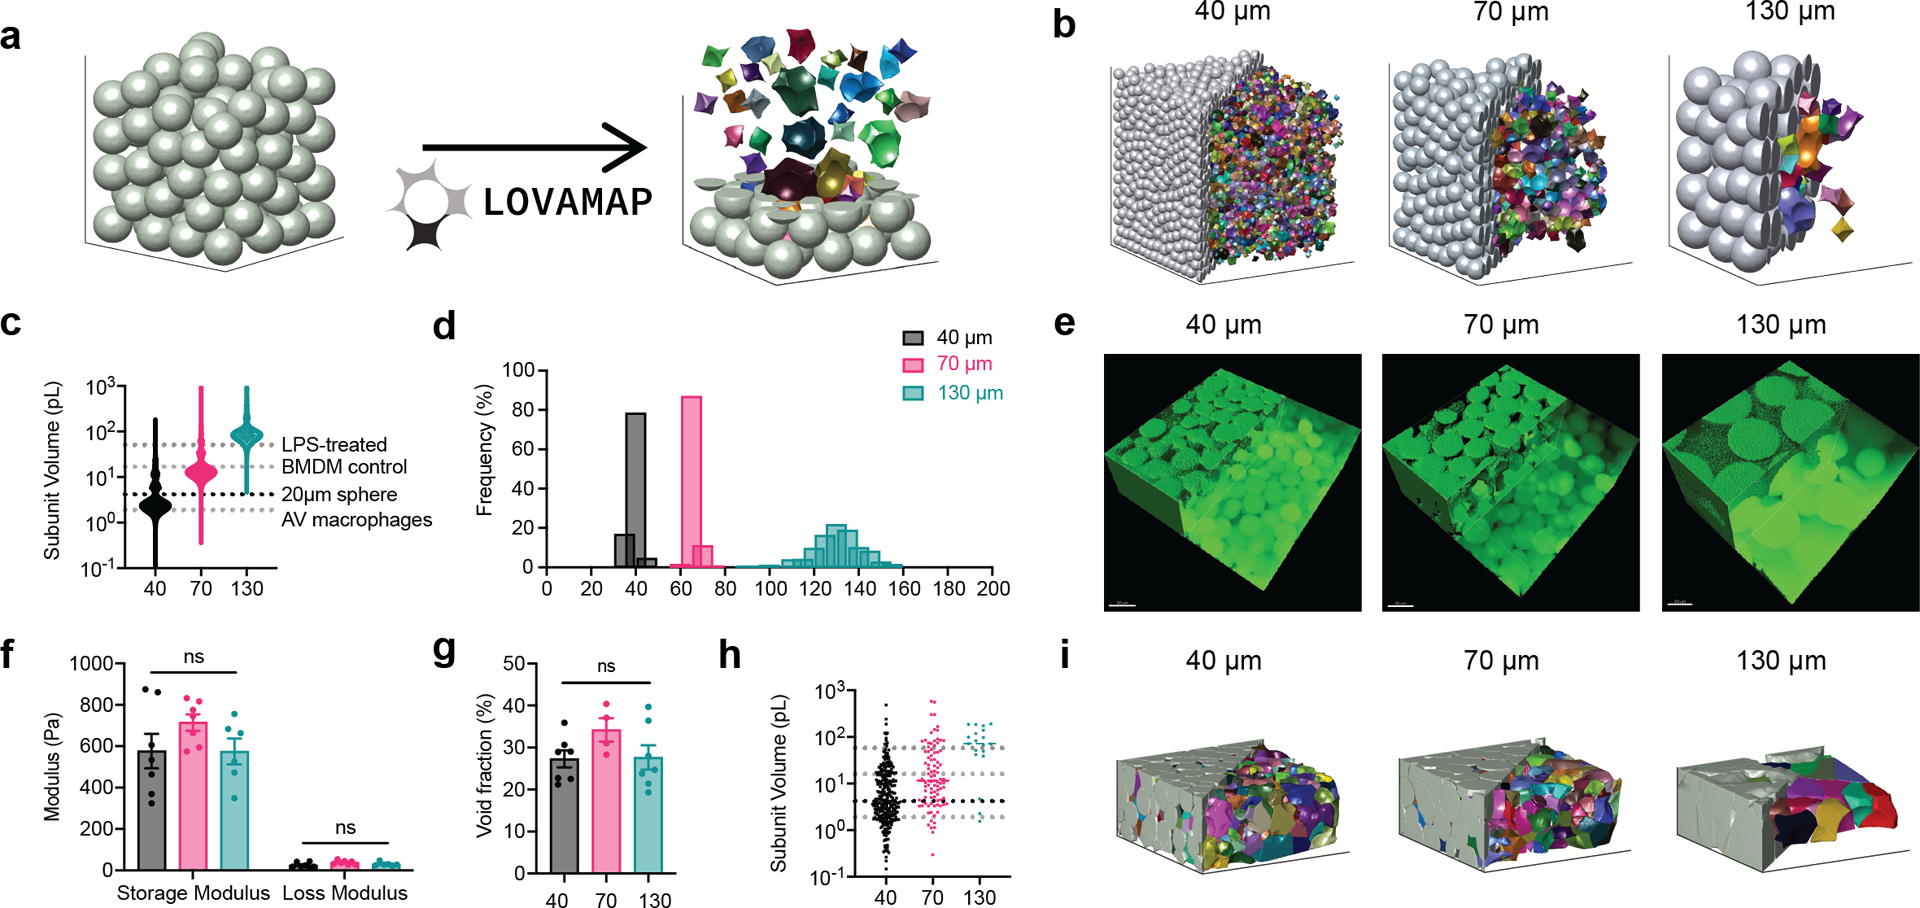
Figure 1. LOVAMAP software guided the design of MAP Scaffold with controllable 3D-pore size.

a, LOVAMAP processes the images of MAP scaffolds and extracts information regarding 3D-pores inside the scaffolds. Microgels are grey and 3D-pores are colored, shown separated from one another to highlight variation in form. b, LOVAMAP outputs of three simulated MAP Scaffold comprising 40 μm, 70 μm and 130 μm diameter spherical microgels. c, 3D-pore volumes for 40 μm, 70 μm and 130 μm diameter simulated MAP scaffolds (n = 10 scaffolds per type) compared to the size of previously reported alveolar (AV) macrophages, untreated BMDM, and LPS-treated BMDM. d, Microgels were monodisperse in size (40 ± 2.9 μm, 70 ± 3.3 μm, and 130.8 ± 9.2 μm). e , Fluorescent images showing 40 μm, 70 μm and 130 μm diameter MAP scaffolds (scale bar 50 μm). f, Three types of MAP scaffolds had comparable storage and loss modulus. g, Void fraction in MAP scaffolds. Void fraction = (Total volume - Microgel volume) / Total volume. h, 3D-pore volumes for 40 μm, 70 μm and 130 μm diameter of lab-derived MAP scaffolds i, LOVAMAP outputs of lab-derived 40 μm, 70 μm and 130 μm MAP scaffolds. Microgels are grey, and 3D-pores are colored. Statistical analysis: one-way ANOVA with Tukey’s multiple comparisons test made between 40 μm, 70 μm and 130 μm MAP scaffolds groups only when there was significant difference among means. * p<0.05, ** p<0.01, *** p<0.001, **** p<0.0001. Error bars, mean ± s.e.m. n = 6 samples per scaffold type.
