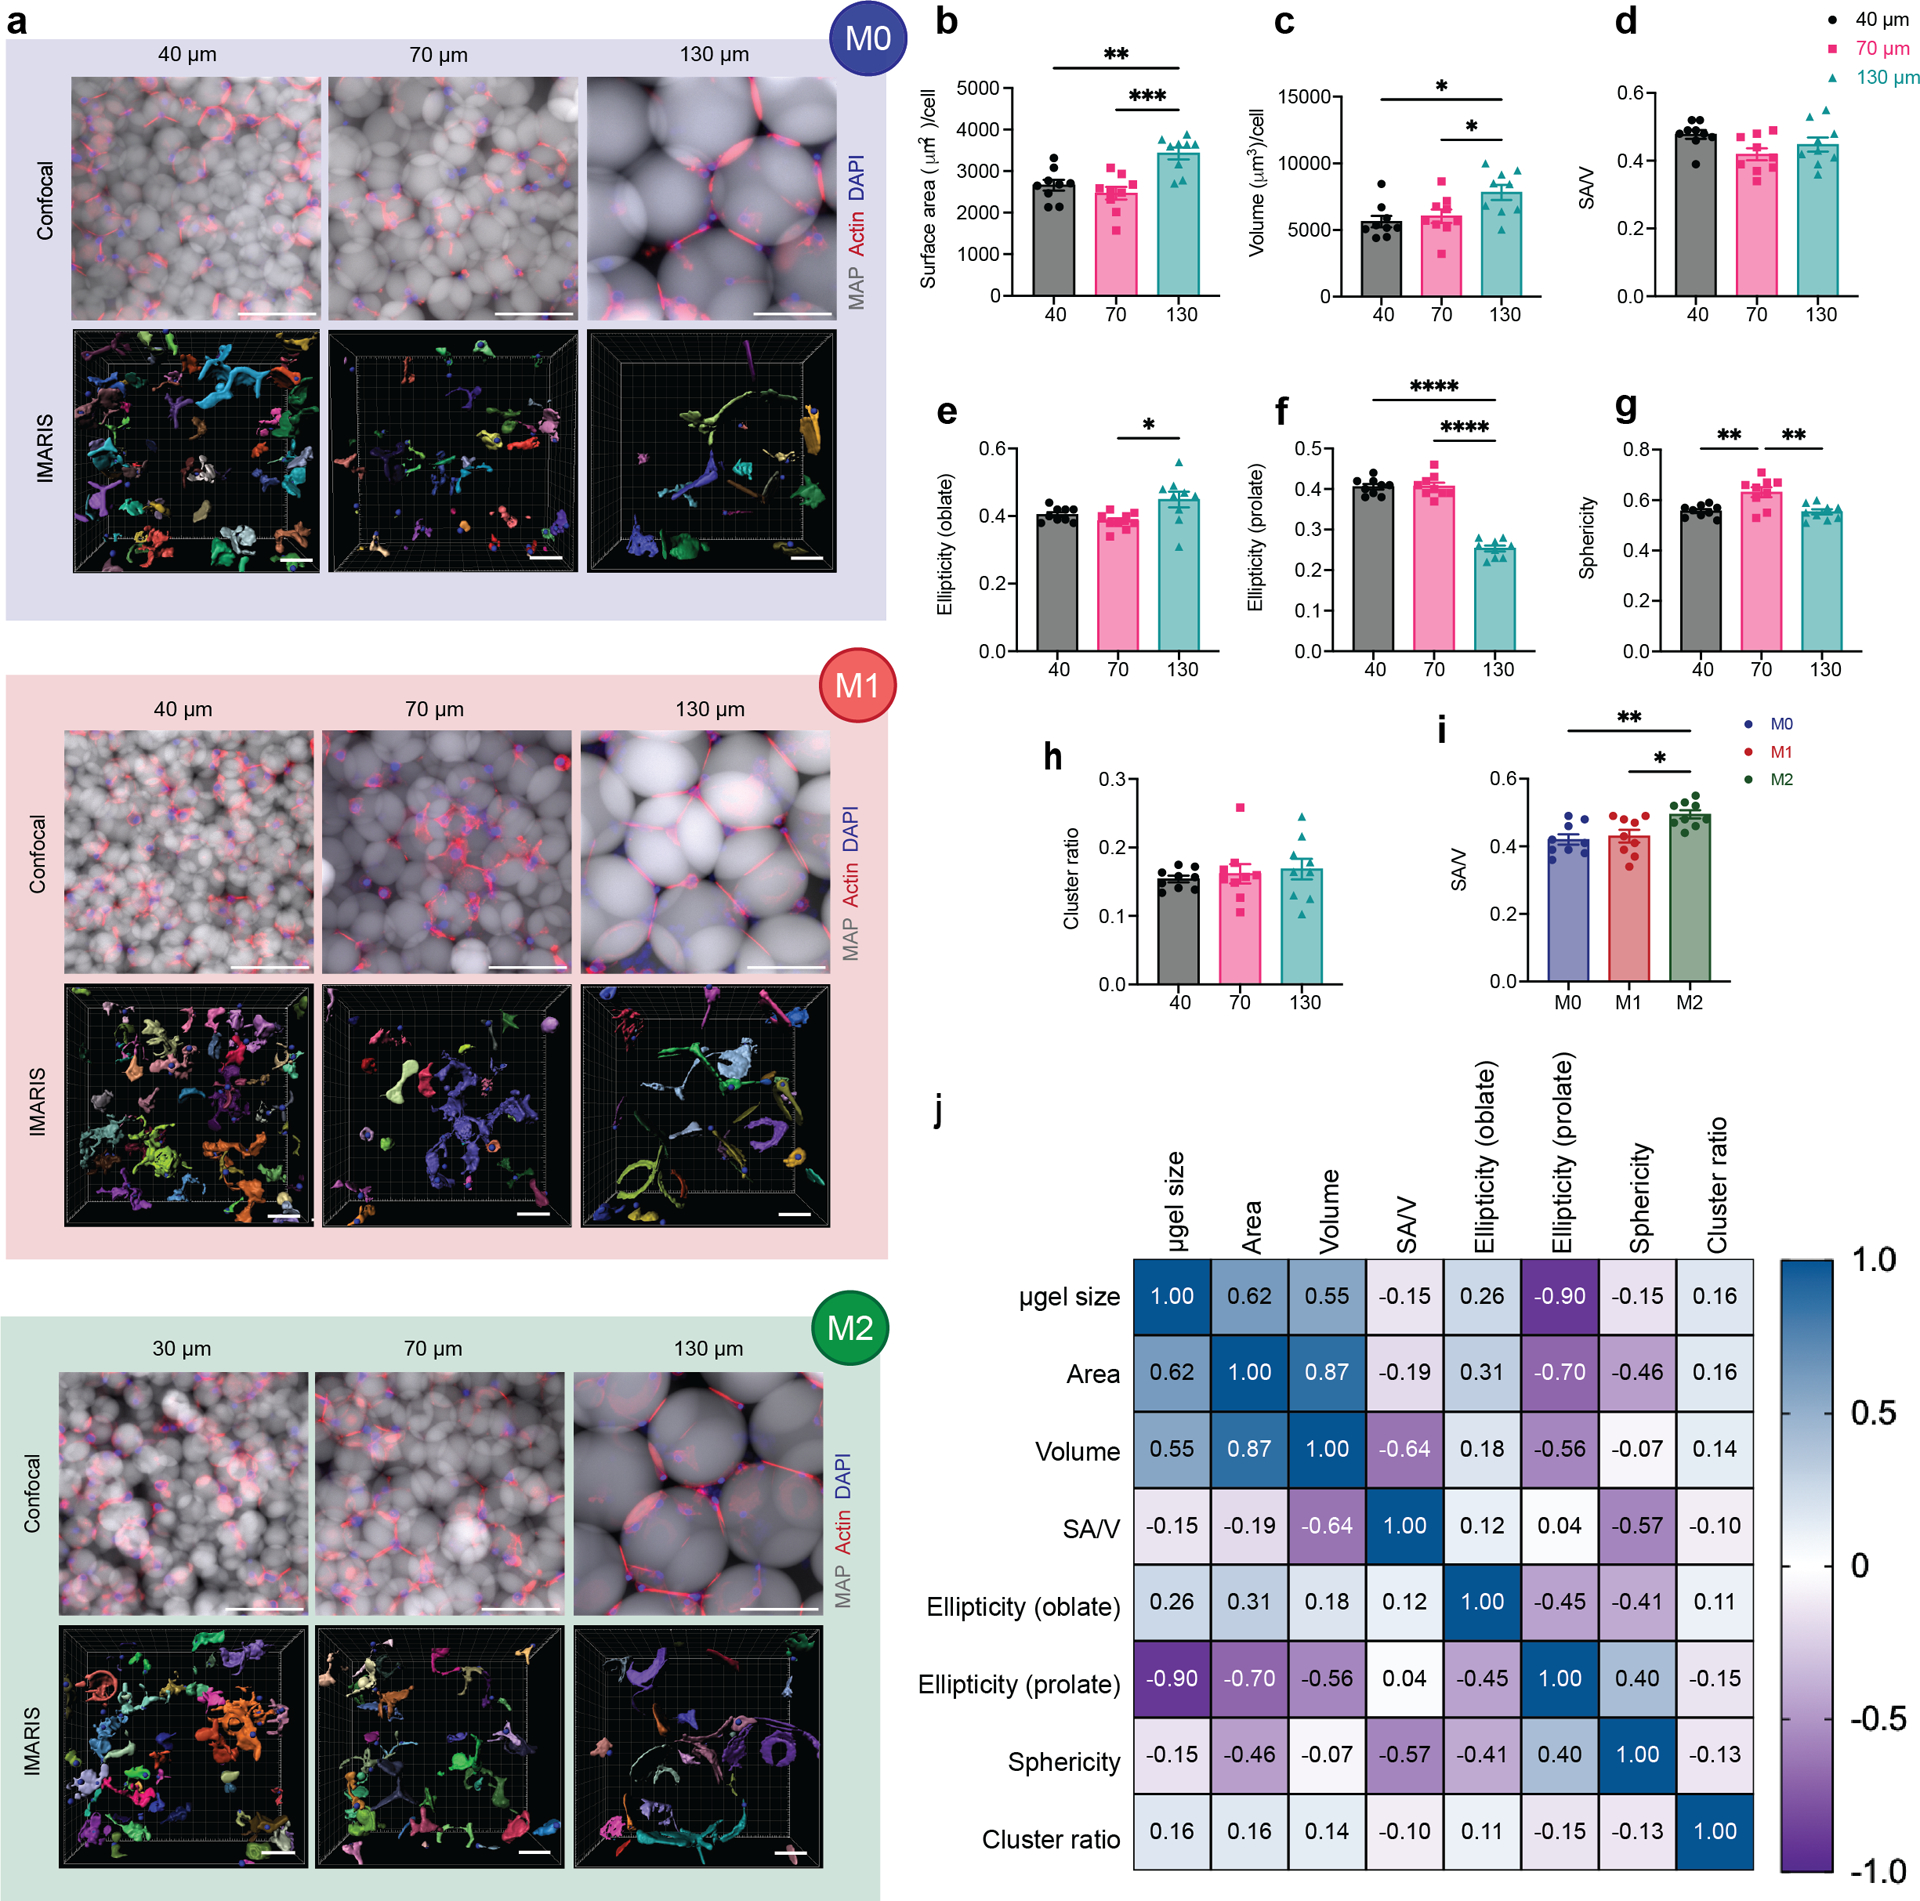
Figure 2. Macrophages showed divergent morphologies upon spatial confinement in MAP GELS.

a, Fluorescent images showing BMDM encapsulated in MAP scaffolds with M0, M1 (LPS/IFNγ), and M2 (IL-4) activation (top row: microgels in grey, actin filaments in red, nuclei in blue, scale bar 100 μm) and the IMARIS software renderings of the single cells and cell clusters in MAP scaffolds (bottom row: colored units, scale bar 50 μm). b-h, Cell morphological parameters of BMDM encapsulated in different MAP scaffolds, combining three activation types: b, sum of total surface area normalized by cell number; c, sum of total volume normalized by cell number; d, surface area-to-volume ratio; e, ellipticity (oblate); f, ellipticity (prolate); g, sphericity; h, cluster ratio. i, Surface area-to-volume ratio of cells cultured in MAP scaffolds after M0, M1, and M2 activation. j, Correlation matrix of cell morphological parameters (blue represents positive correlation and purple represents negative correlation). Statistical analysis: one-way ANOVA with Tukey’s multiple comparisons test made between 40 μm, 70 μm and 130 μm MAP scaffolds groups only when there was significant difference among means. * p<0.05, ** p<0.01, *** p<0.001, **** p<0.0001. Error bars, mean ± s.e.m., n = 9 per group.
