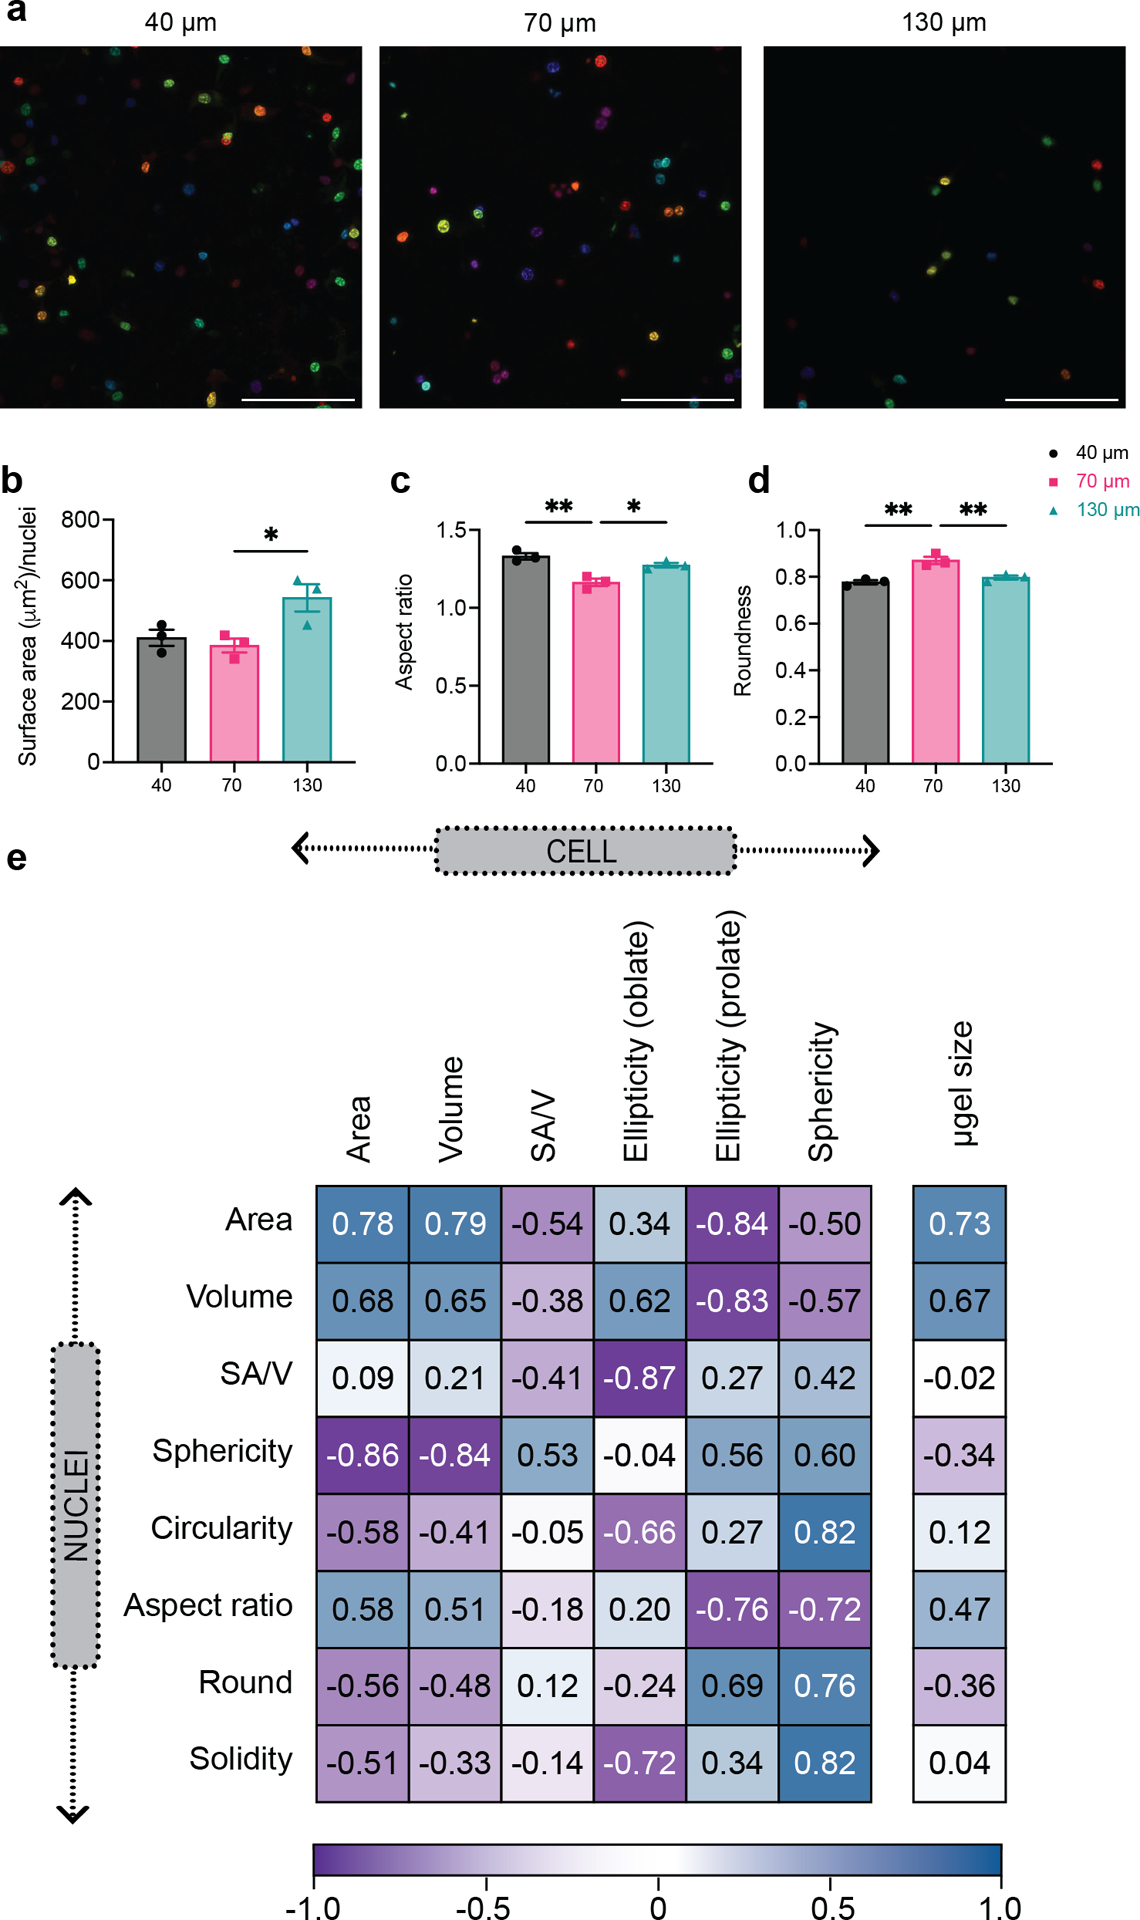
Figure 3. Macrophages showed divergent nuclear shape upon spatial confinement in MAP scaffolds.

a, Mean intensity projection images of cell nuclei from confocal images of 3D MAP scaffolds scaffolds (scale bar 100 μm). b-d, morphology analysis of nuclei shape for unstimulated BMDM in MAP scaffolds, showing surface nuclei area, aspect ratio, and roundness. e, Correlation matrix of selected cellular morphology and nuclear shape characteristics for unstimulated BMDM in MAP scaffolds. Statistical analysis: one-way ANOVA with Tukey’s multiple comparisons test made between 40 μm, 70 μm, and 130 μm MAP scaffolds groups only when there was significant difference among means. * p<0.05, ** p<0.01, *** p<0.001, **** p<0.0001. Error bars, mean ± s.e.m., n = 3 from three independent experiments per scaffold type.
