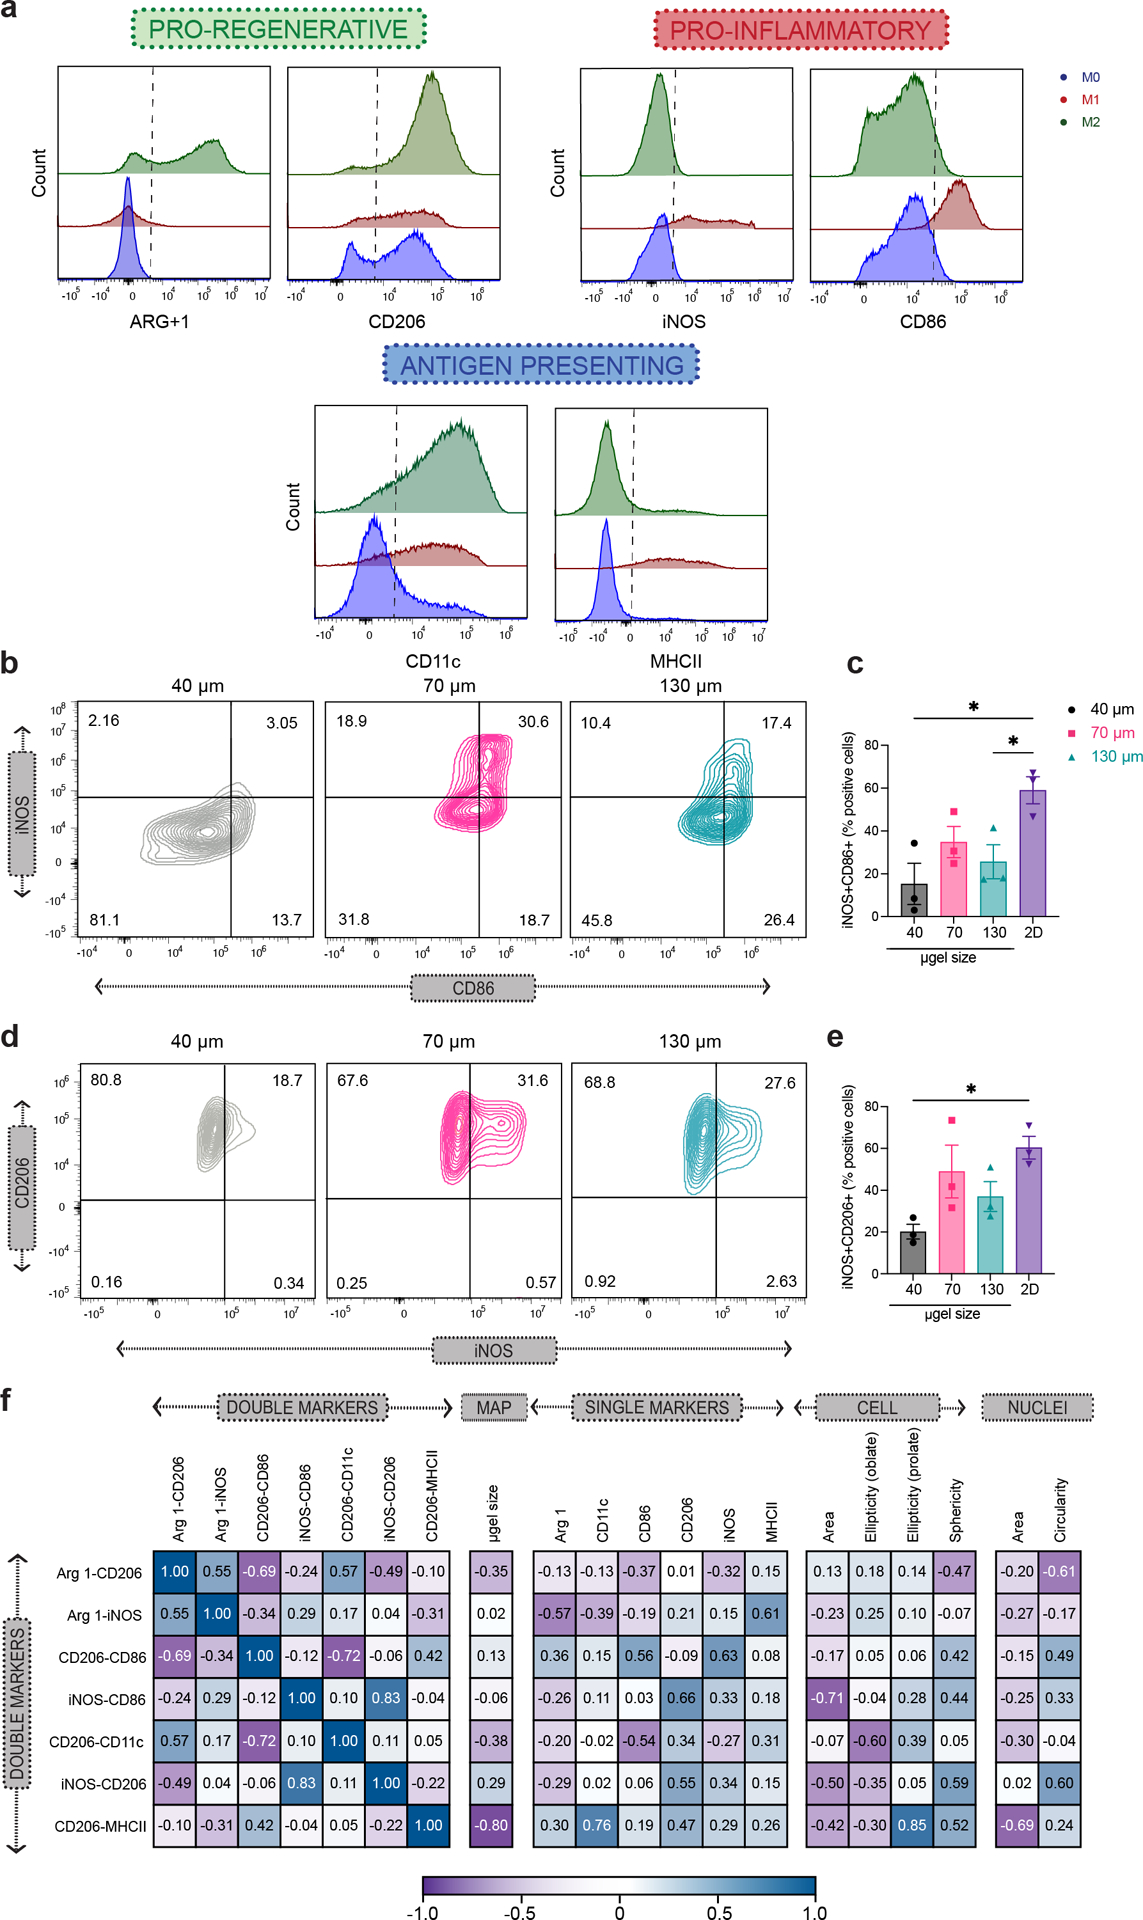
Figure 5. Balance of M1/M2 phenotype was observed upon M1 activation in MAP scaffolds .

a, Representative histogram of phenotypical marker expression levels from the flow cytometry analysis of 2D culture BMDM upon M1(LPS/IFNγ) activation, showing pro-inflammatory markers iNOS and CD86, pro-regenerative markers Arg1 and CD206, and antigen-presenting markers CD11c upon M1(LPS/IFNγ) activation. Positive expression threshold was determined as above the MFI of unstimulated BMDM. b and d, Representative contour plots of BMDM upon M1(LPS/IFNγ) activation in 40 μm, 70 μm and 130 μm MAP scaffolds, showing iNOS and CD86 co-expression levels as well as iNOS and CD206 co-expression levels. c and e, Percentages of double-positive BMDM subpopulation upon M1(LPS/IFNγ) activation for iNOS/CD86 co-expression and iNOS/CD206 co-expression. f, Correlation matrix between double-positive BMDM subpopulation upon M1(LPS/IFNγ) activation, selected phenotypical markers, and selected morphological characteristics of BMDM in MAP scaffolds. Statistical analysis: one-way ANOVA with Tukey’s multiple comparisons test made between 40 μm, 70 μm and 130 μm MAP scaffolds groups only when there was significant difference among means. * p<0.05, ** p<0.01, *** p<0.001, **** p<0.0001. Error bars, mean ± s.e.m., n = 3 from three independent experiments per scaffold type.
