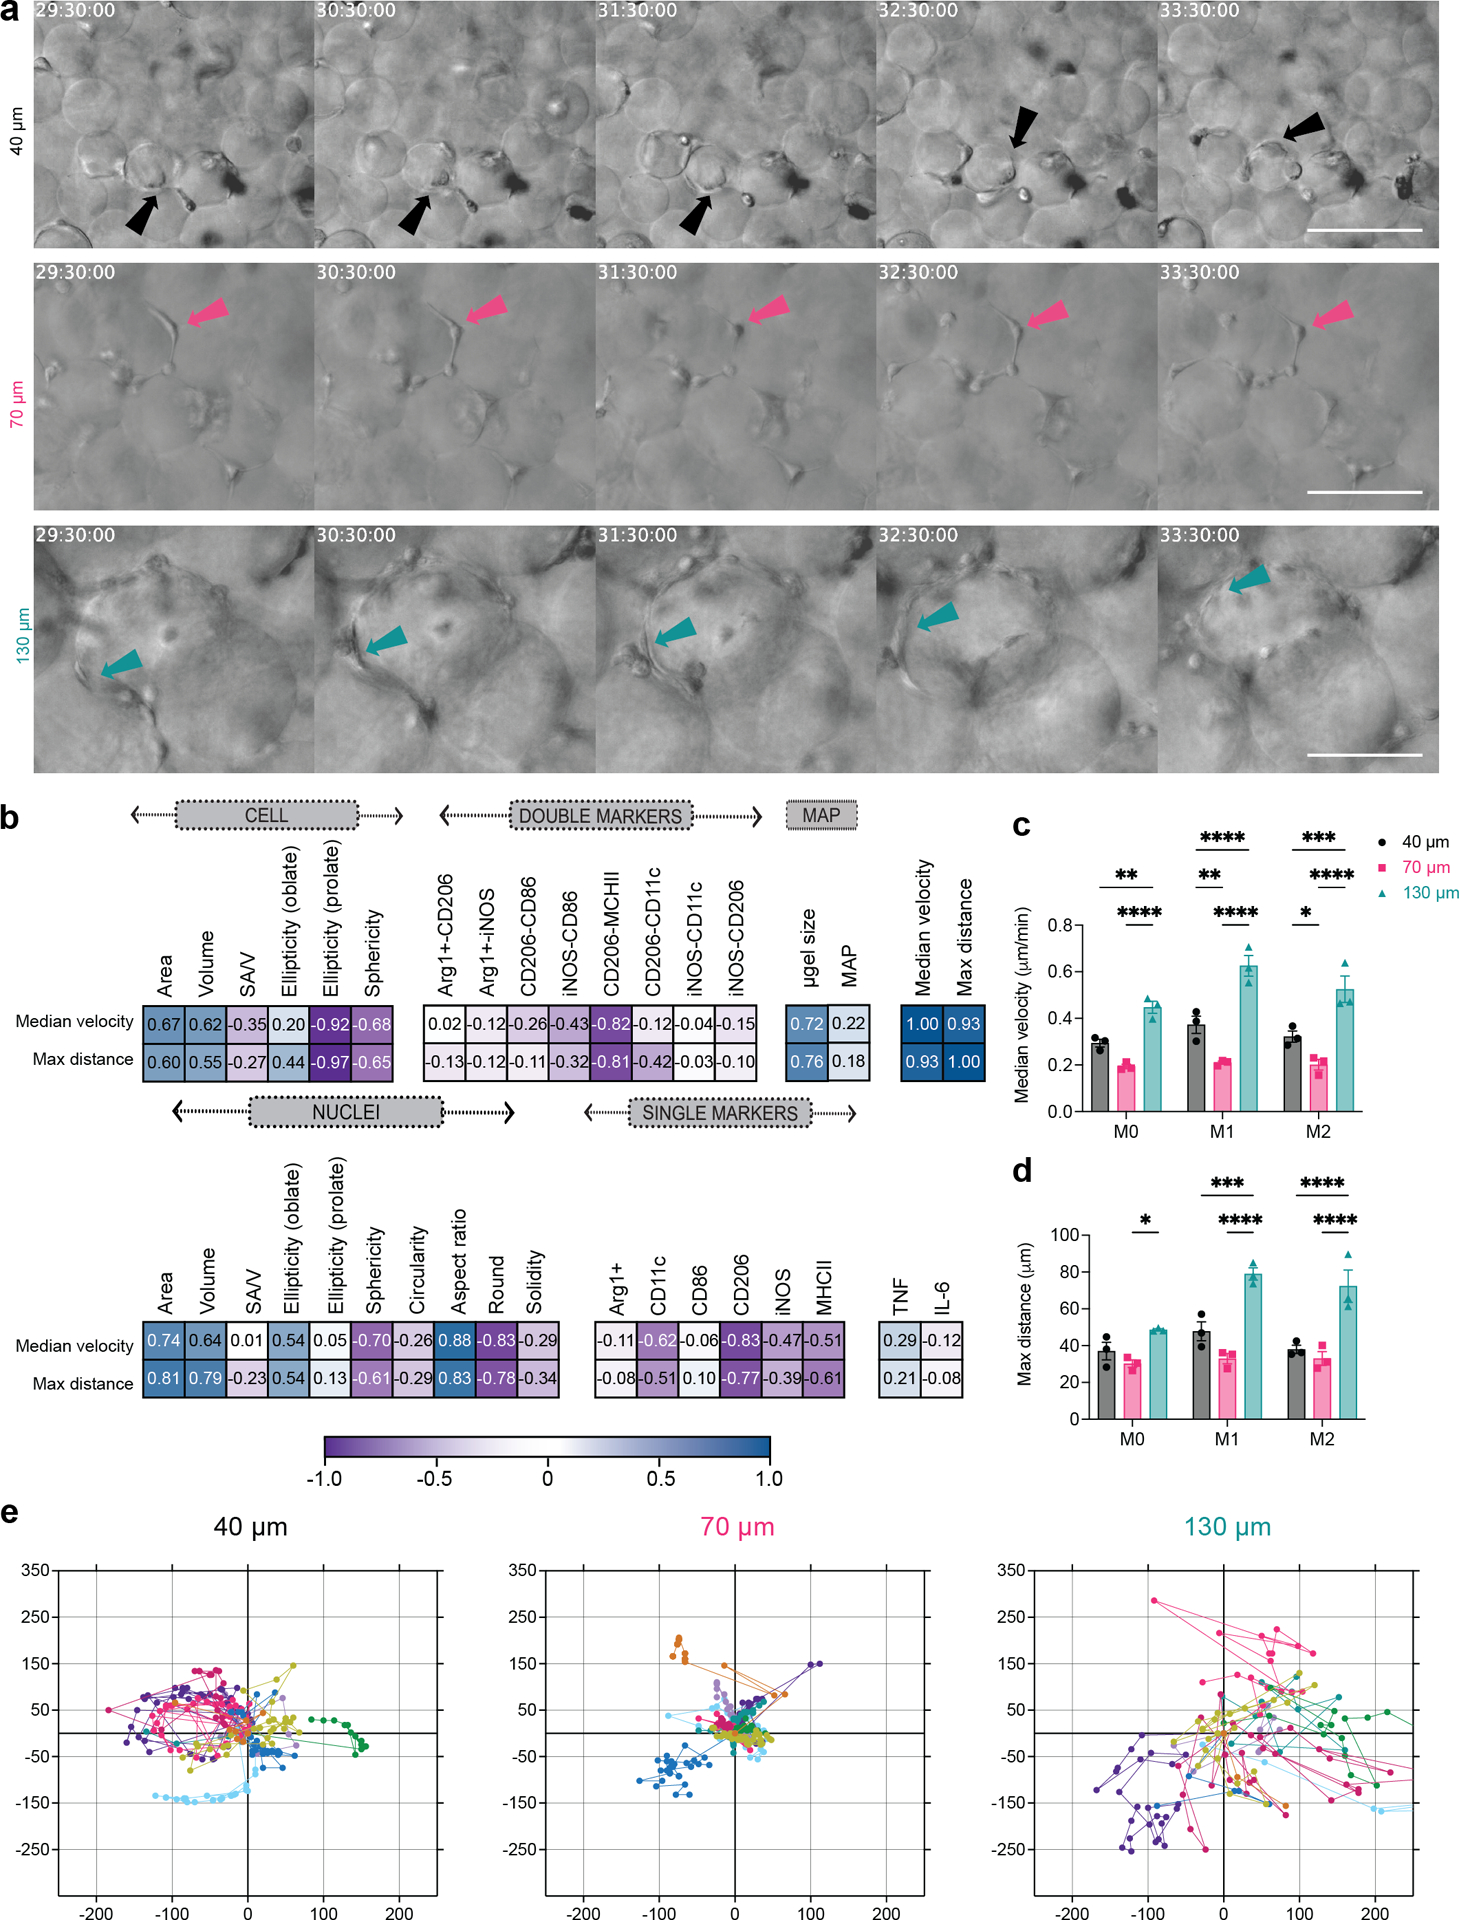
Figure 6. Spatial confinement influenced macrophage motility by changing cell trajectory and velocity.

a, Representative frames from live-cell imaging video of BMDM upon M1(LPS/IFNγ) activation in 40 μm, 70 μm and 130 μm MAP scaffolds. b Correlation matrix between macrophage motility parameters, double-positive BMDM subpopulation upon M1(LPS/IFNγ) activation, phenotypical markers, and morphological characteristics of BMDM in MAP scaffolds. c, Median velocity of unstimulated/M0 or M1 or M2 BMDM in MAP scaffolds. d, Maximum total travel distance of unstimulated/M0 or M1 or M2 BMDM in MAP scaffolds. e, Representative plots of BMDM displacement from origin for 20 hours in 40 μm, 70 μm and 130 μm MAP scaffolds. n = 10 cells in each plot. Statistical analysis: two-way ANOVA with Tukey’s multiple comparisons test made between 40 μm, 70 μm and 130 μm MAP scaffolds groups only when there was a significant difference in scaffold type x treatment. * p<0.05, ** p<0.01, *** p<0.001, **** p<0.0001. Asterisks in black show difference within a treatment and between scaffold type. Error bars, mean ± s.e.m., n = 3 independent experiments per scaffold type.
