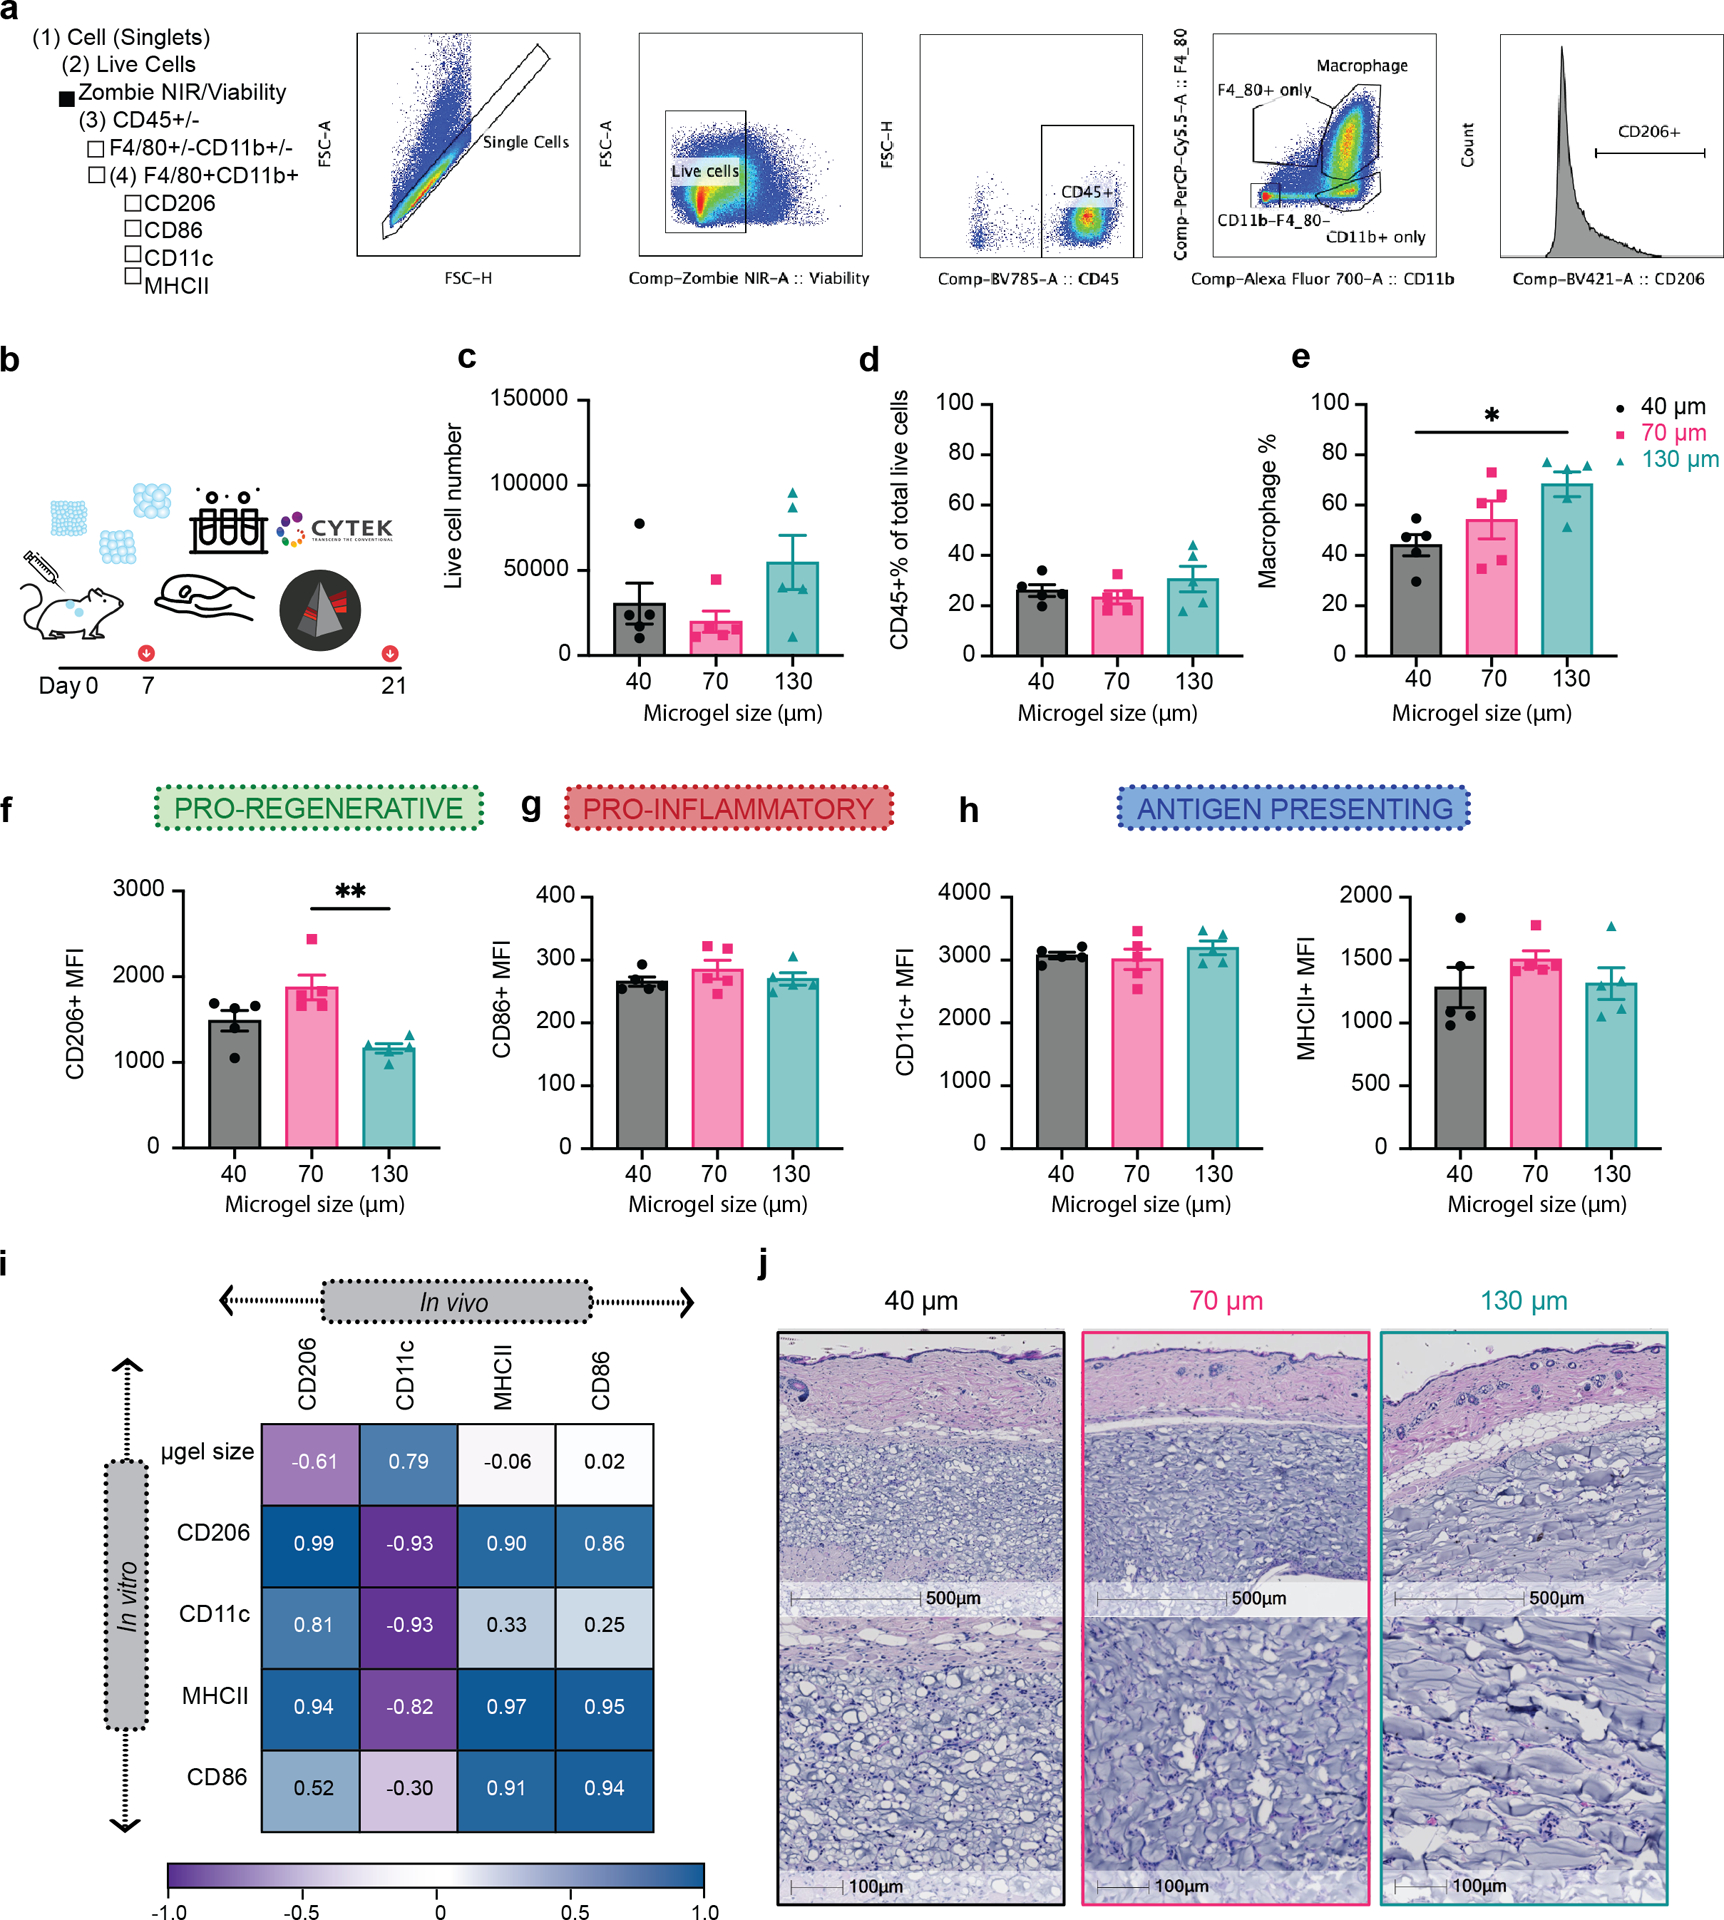
Figure 7. Macrophage phenotypes revealed similar patterns between in vivo and in vitro experiments.

a, Scheme illustration of the experiment timeline. After the initial injections, implant extraction and specific assays were performed at day 7 (flow cytometry) and day 21 (H&E). b, Gating strategy for flow cytometry analysis. c, The total number of live cells (Zombie NIR-) in different MAP scaffolds groups. d, Percentage of CD45+ immune cells (CD45+) in different MAP scaffolds groups. e, Macrophages percentage (CD11b+F4/80+) in CD45+ cells in different MAP scaffolds groups. f-i, Expression levels of pro-regenerative marker CD206, pro-inflammatory marker CD86 and antigen presenting markers MHCII and CD11c in infiltrating macrophages at day 7. l, Correlation plot of the average expression levels of phenotypical markers between in vivo and in vitro experiments. j-k, histologic quantification of vessel count and percentage of granulation tissue in the implant .m, Representative pictures of the implants stained with Hematoxylin and eosin (H&E) on day 21. Black stars represent microgel remaining in the implant, pink start represents granulation tissue surrounding the microgels and green-blue star shows vessel formation inside the implant . Statistical analysis: one-way ANOVA with Tukey’s multiple comparisons test made between 40 μm, 70 μm and 130 μm MAP scaffolds groups only when there was significant difference among means. * p<0.05, ** p<0.01, *** p<0.001, **** p<0.0001. Error bars, mean ± s.e.m., n = 5 male mice per scaffold type.
